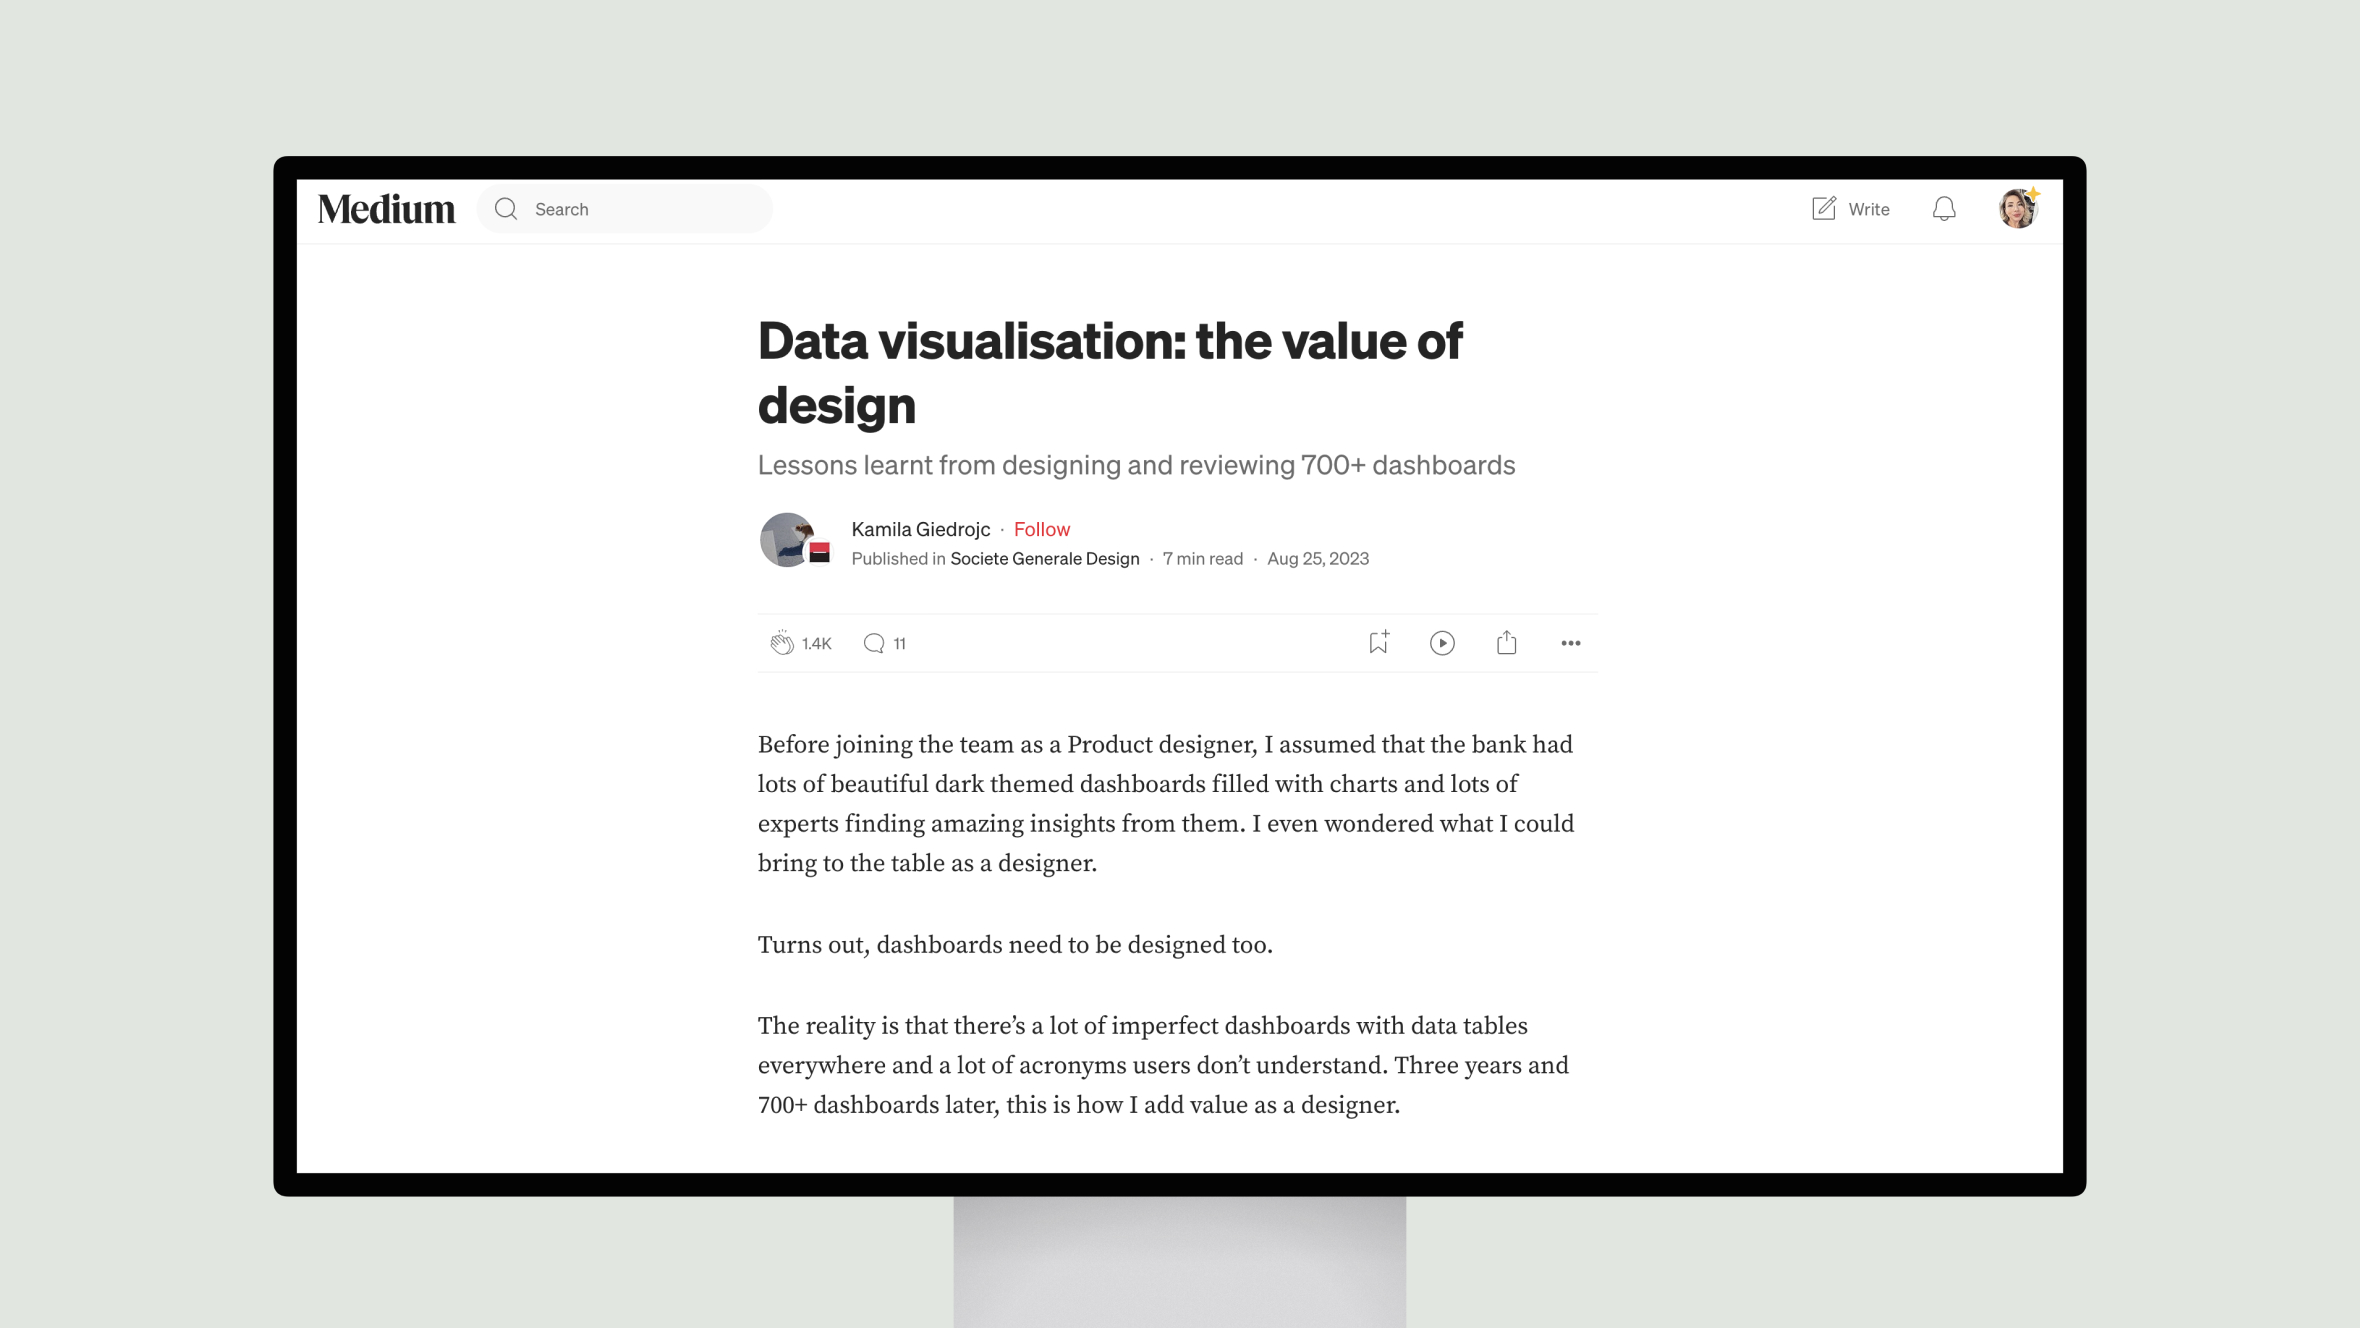
Data visualization is a crucial aspect of effective data analysis and decision-making. Kamila Giedrojc, a Product Designer, shares valuable insights gained from designing and reviewing over 700 dashboards. Key lessons include focusing on only the most essential data users need, selecting the right visualization type to communicate insights, balancing visual complexity with user familiarity, ensuring dashboards support decision-making, condensing information to avoid overwhelming users, providing the right amount of annotation for context, and maintaining visual consistency across all data visualizations.
By following these principles, designers can create impactful data displays that enable quick understanding and informed decision-making.


