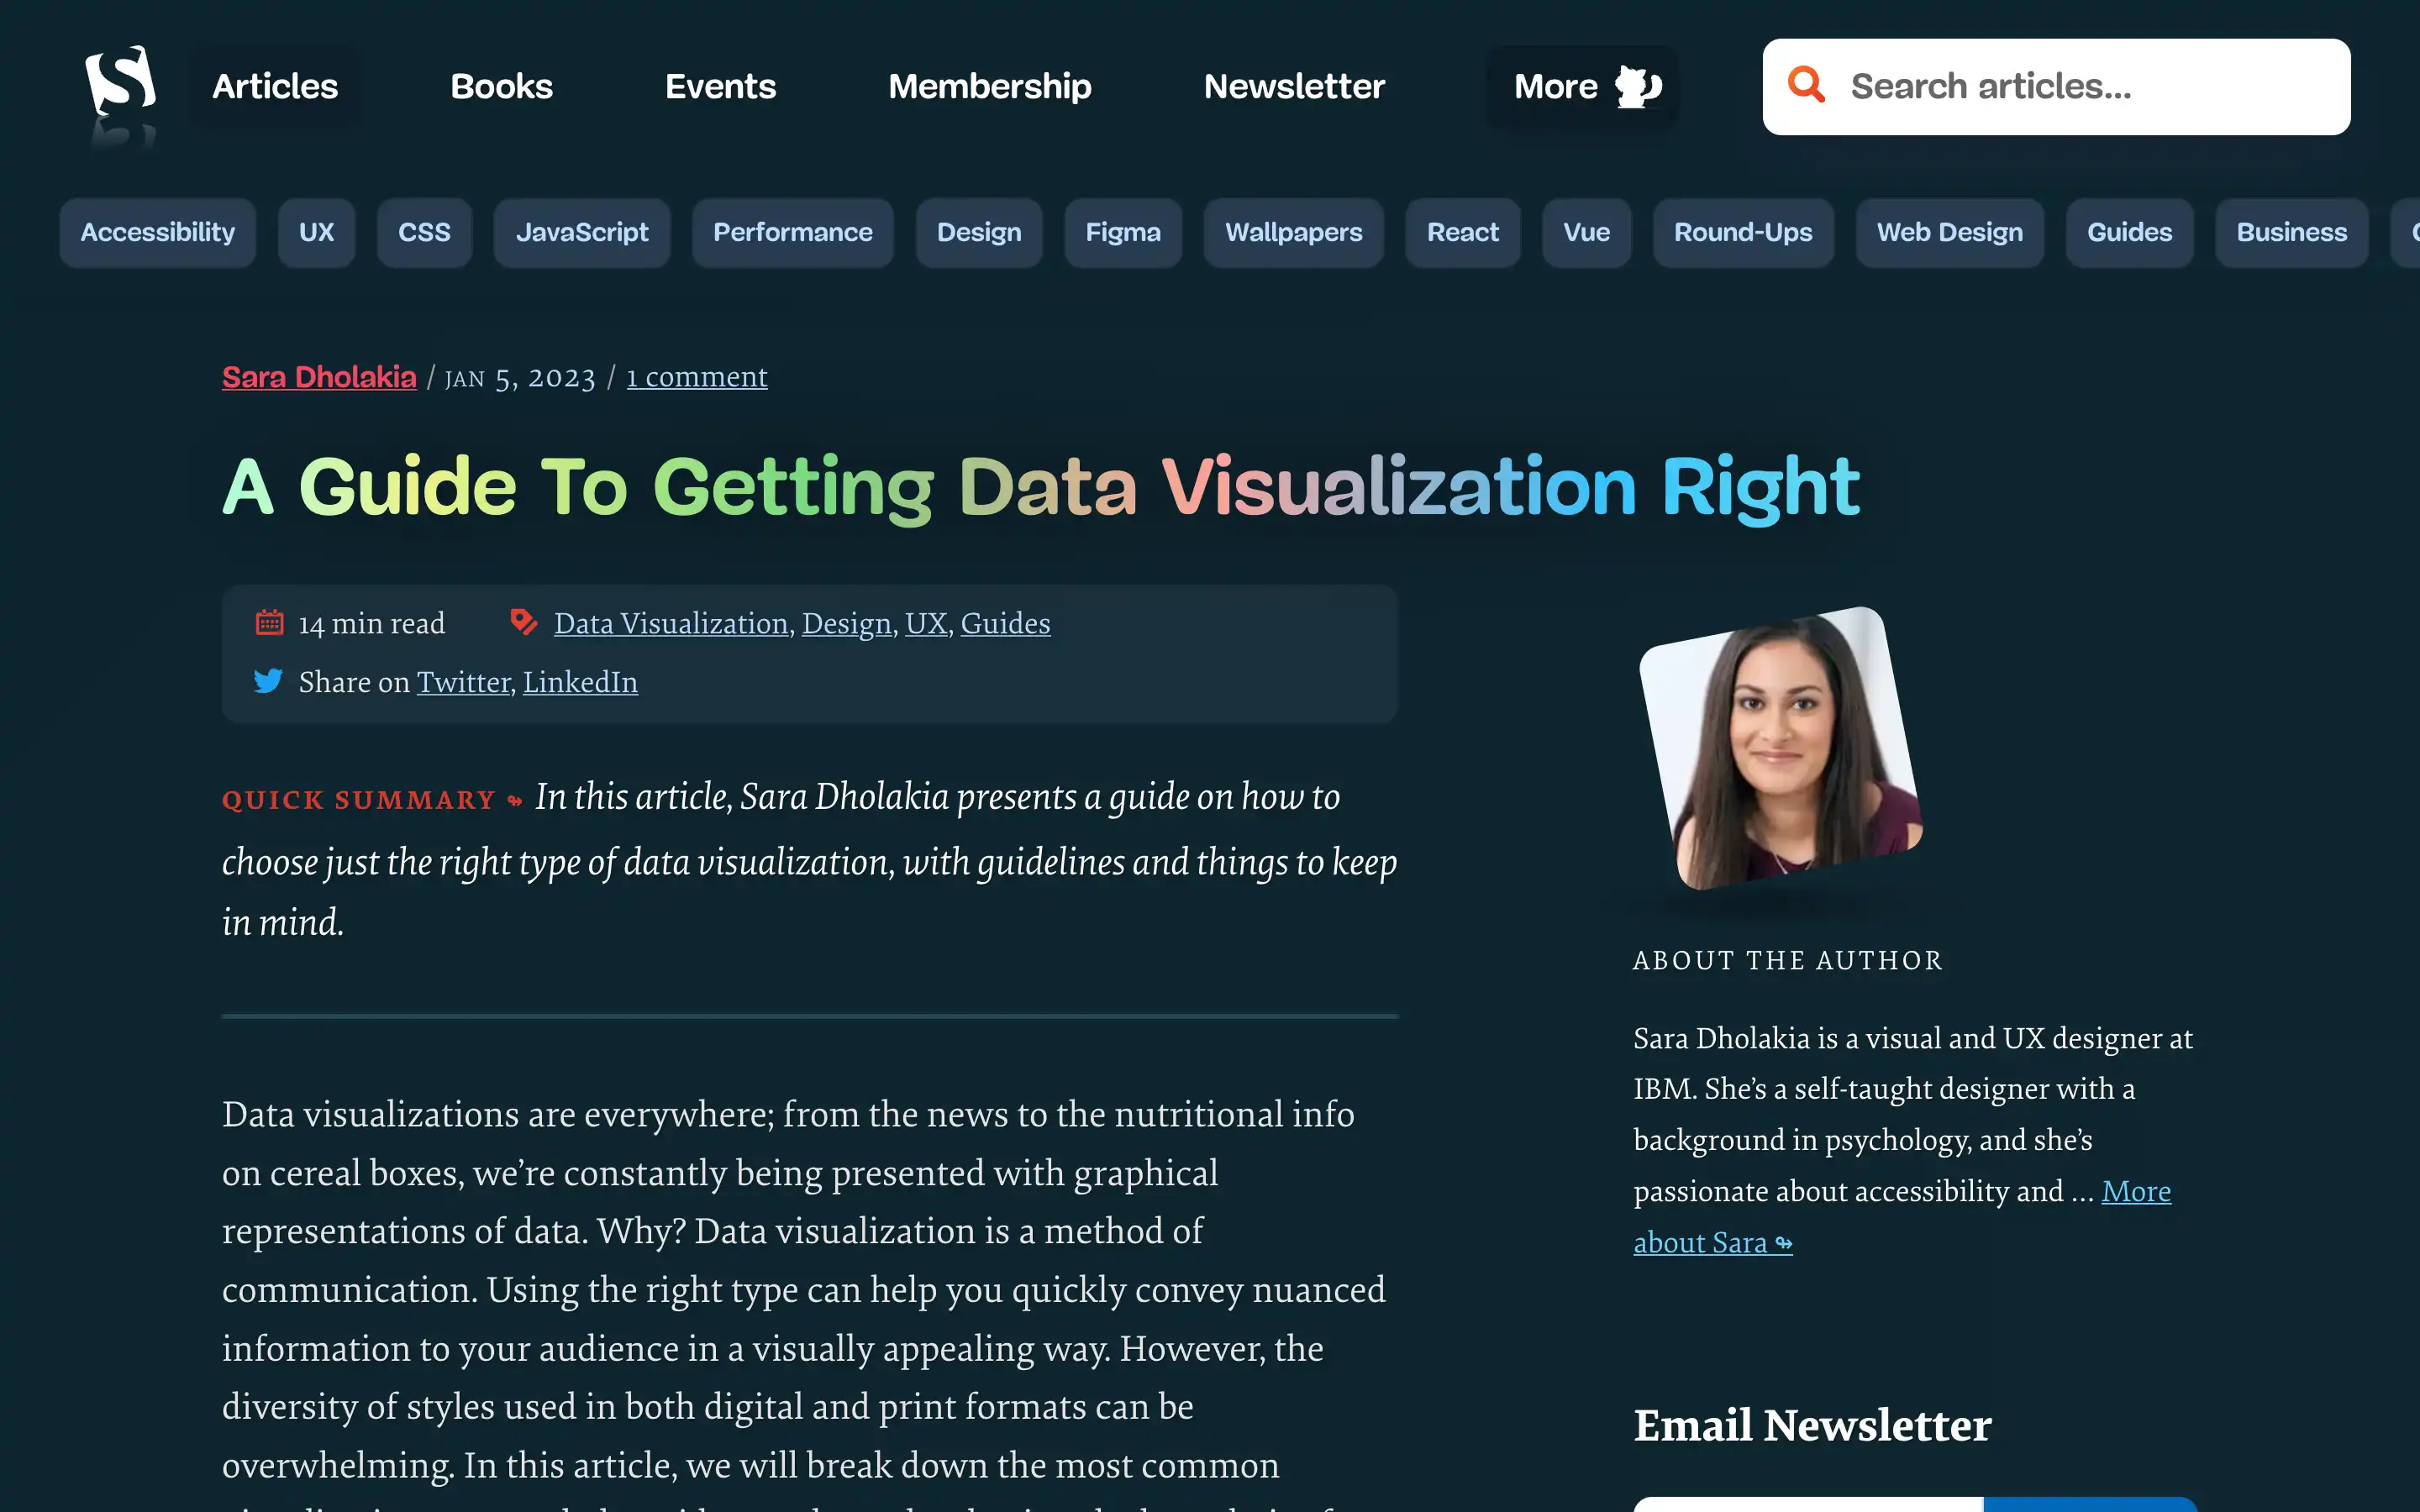
Sara Dholakia’s article offers clear guidance on creating effective data visualizations. It explores essential questions that help determine the right approach, such as the message the data should communicate, the target audience, and which chart types work best with different datasets.
She explains how to avoid common pitfalls in visualization design and provides practical advice on selecting the most appropriate chart types for specific data. By focusing on these principles, the guide helps readers craft visualizations that accurately convey information while engaging the audience.