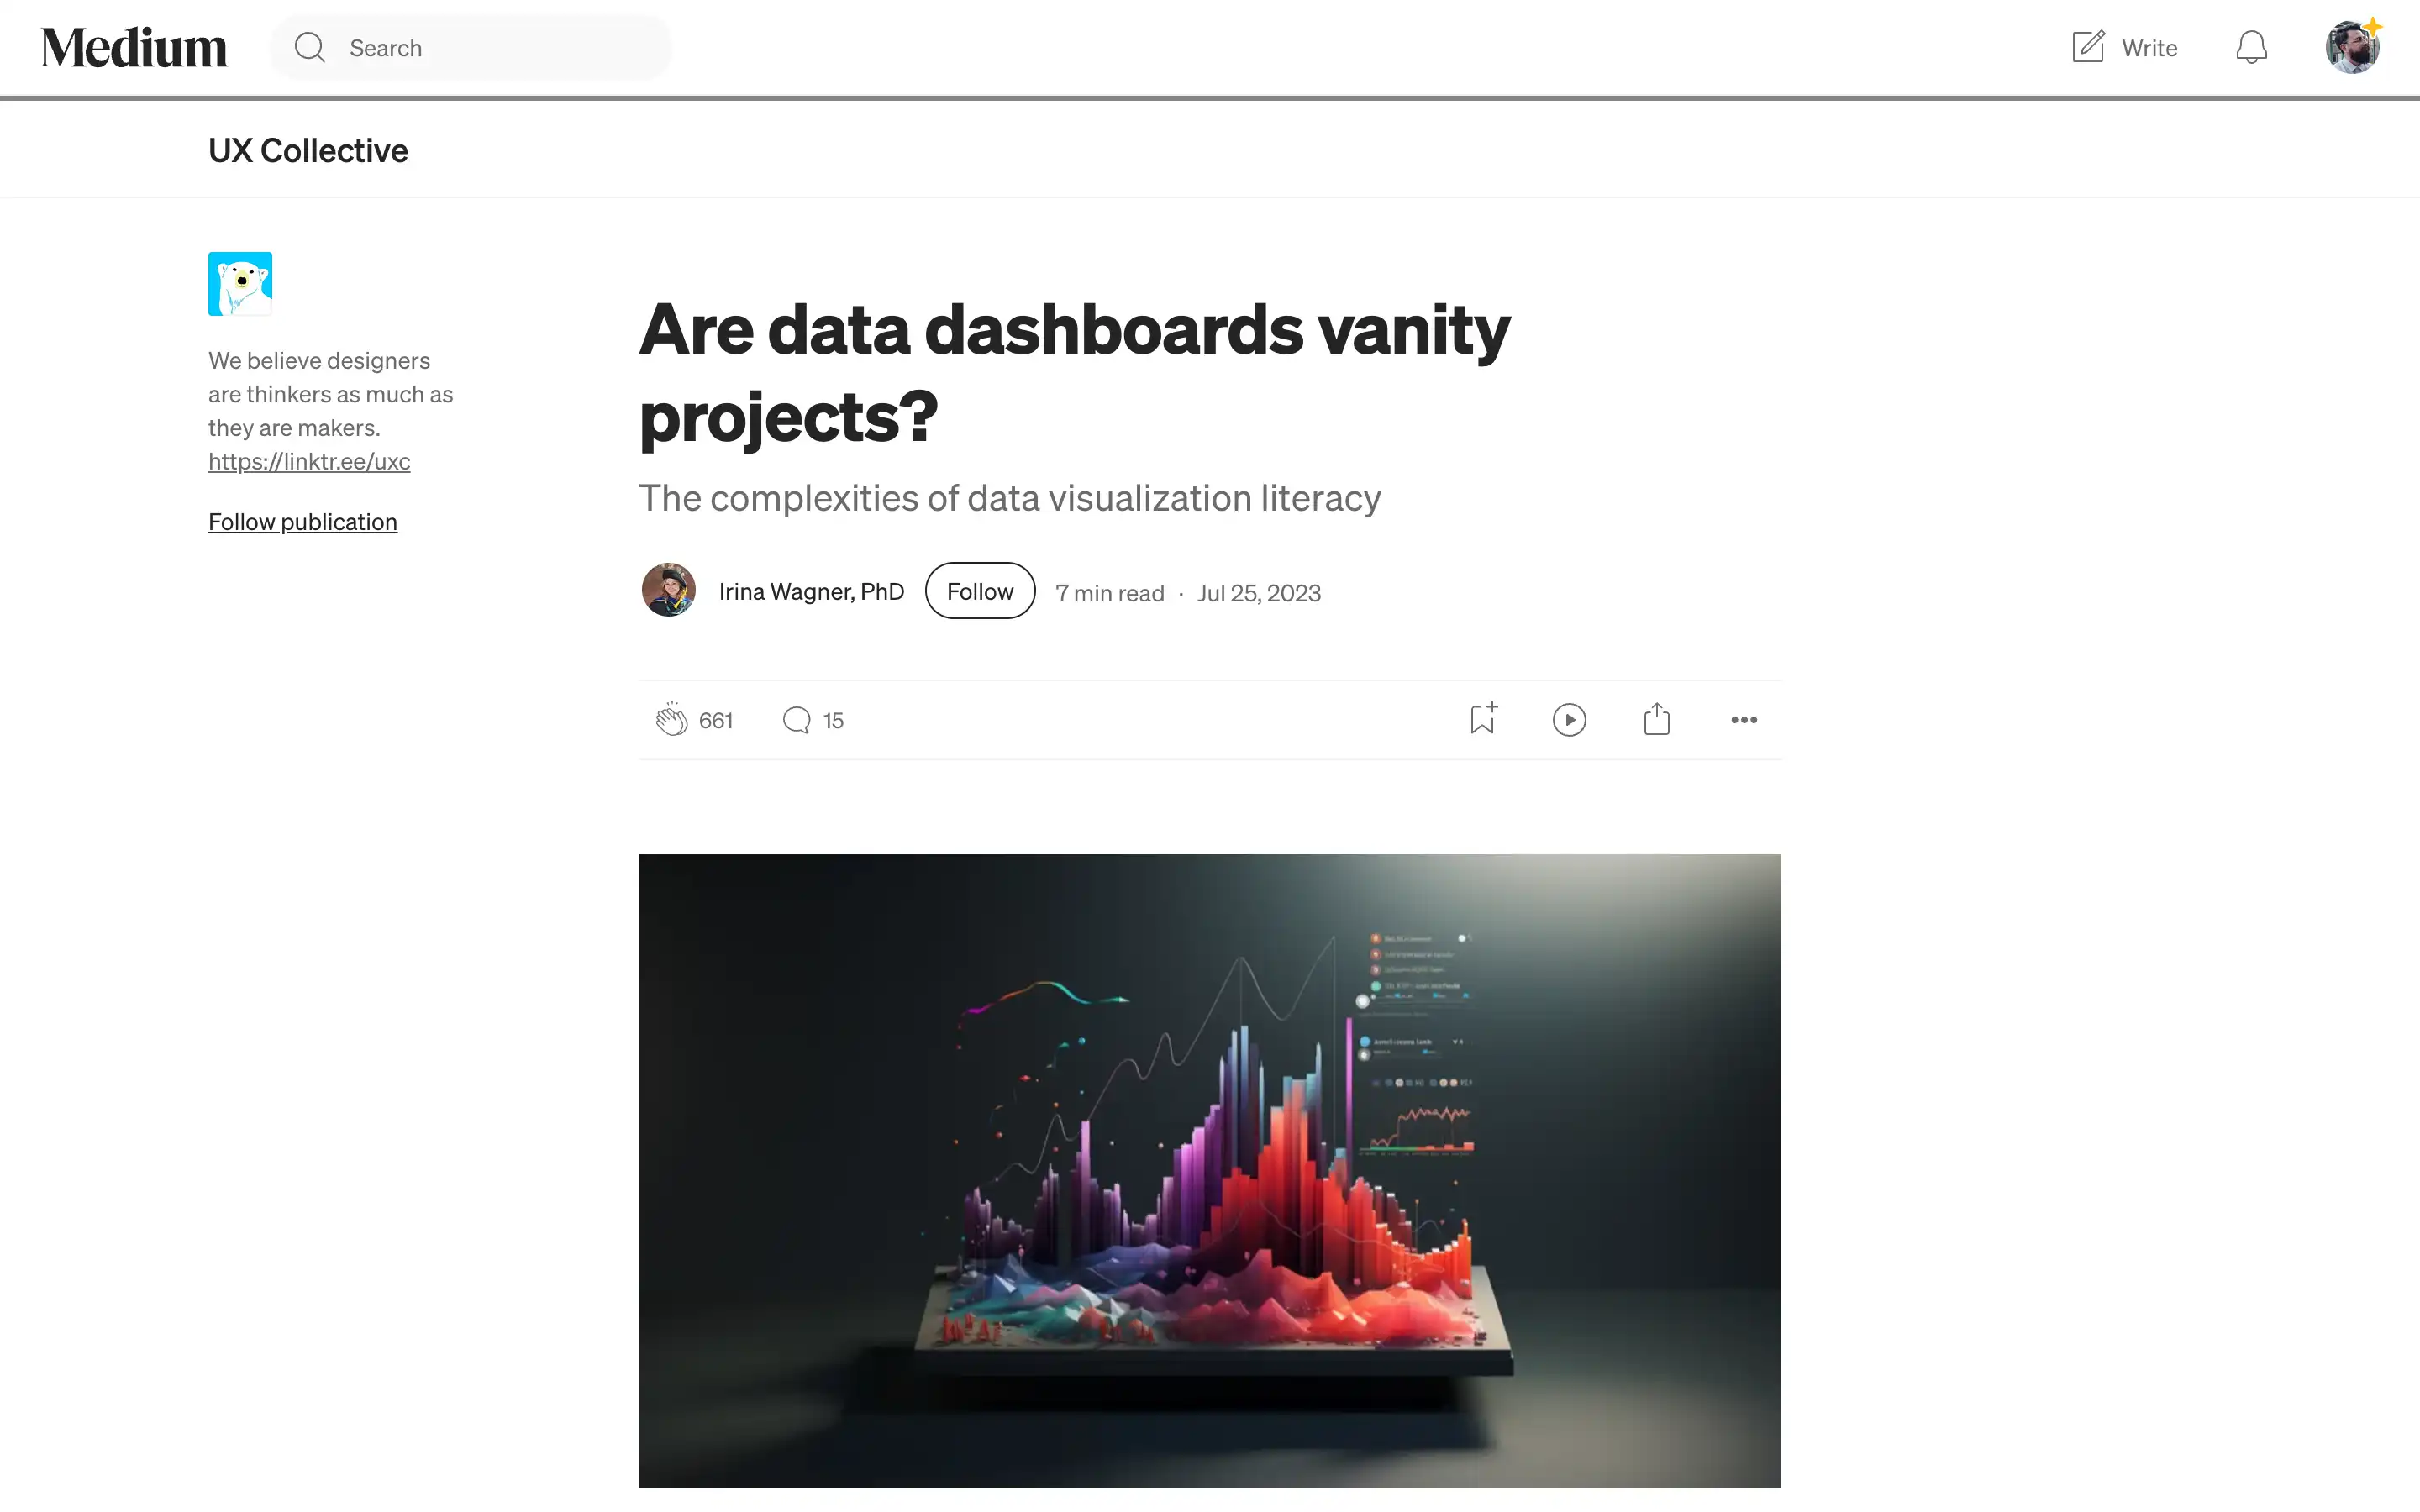
Data dashboards have become ubiquitous in our digital lives, from tracking smartphone usage to monitoring business performance. However, the proliferation of these data visualizations raises questions about their value and effectiveness. Irina Wagner delves into the complexities of data literacy, highlighting the challenges many people face in comprehending and interpreting the information presented in these dashboards.
At the heart of the issue is that data is often messy, biased, and challenging to understand. While data visualizations may seem intuitive, research shows that not all types of visualizations are equally comprehensible. Simple charts and graphs are more easily understood, while more complex layouts like network graphs can overwhelm many users.
Overall, Wagner presents a thought-provoking critique of the widespread use of data dashboards, urging readers to critically examine these tools’ true value and effectiveness in light of the complex realities of data literacy and user needs.