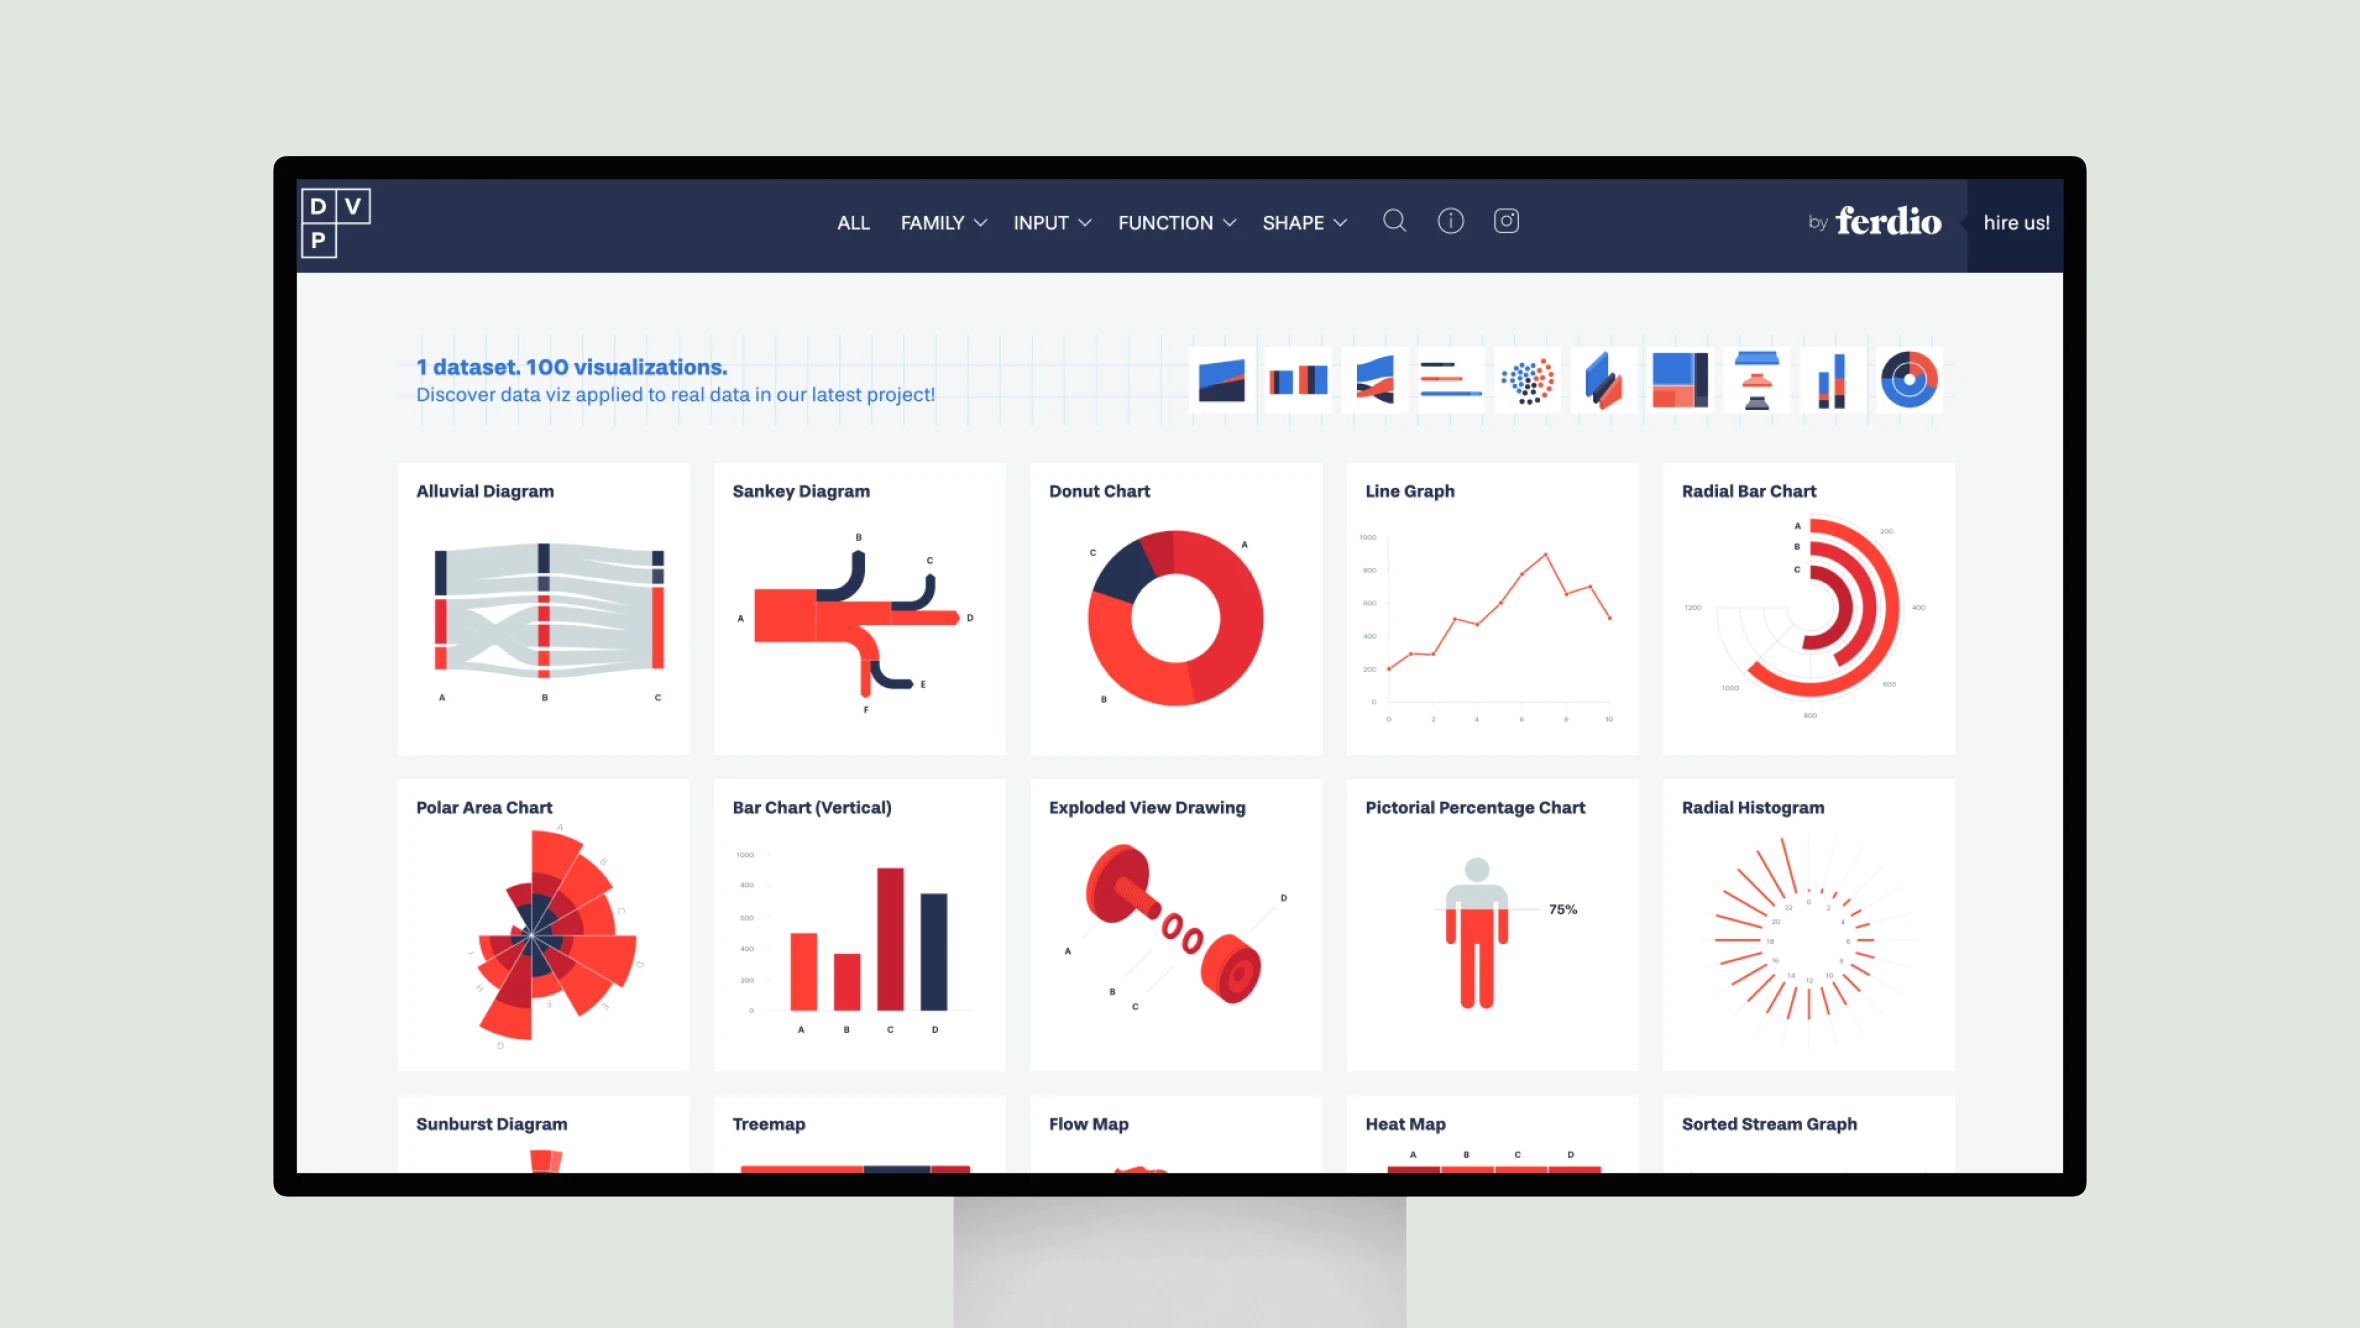
This page on datavizproject.com serves as a catalog of data visualization types compiled by Ferdio, a leading data visualization agency. They showcase over 100 unique chart and graph styles across various categories, providing examples and descriptions to help users find the best way to represent their data visually.
The visualizations are organized into intuitive sections like “comparison” and “correlation” to help the reader explore different options for their specific analysis needs. Each one demonstrates how the format can bring data relationships and patterns to life.
In addition to the extensive visualization gallery, Ferdio offers dataviz design services to translate client data into compelling, customized visual stories. As an industry leader with creativity, insight and experience on their side, Ferdio helps businesses and organizations harness the power of visual communication.
The curated collection and design services showcased on this page by Ferdio aim to inspire, inform and connect users with the right solution to clearly illustrate their data insights.