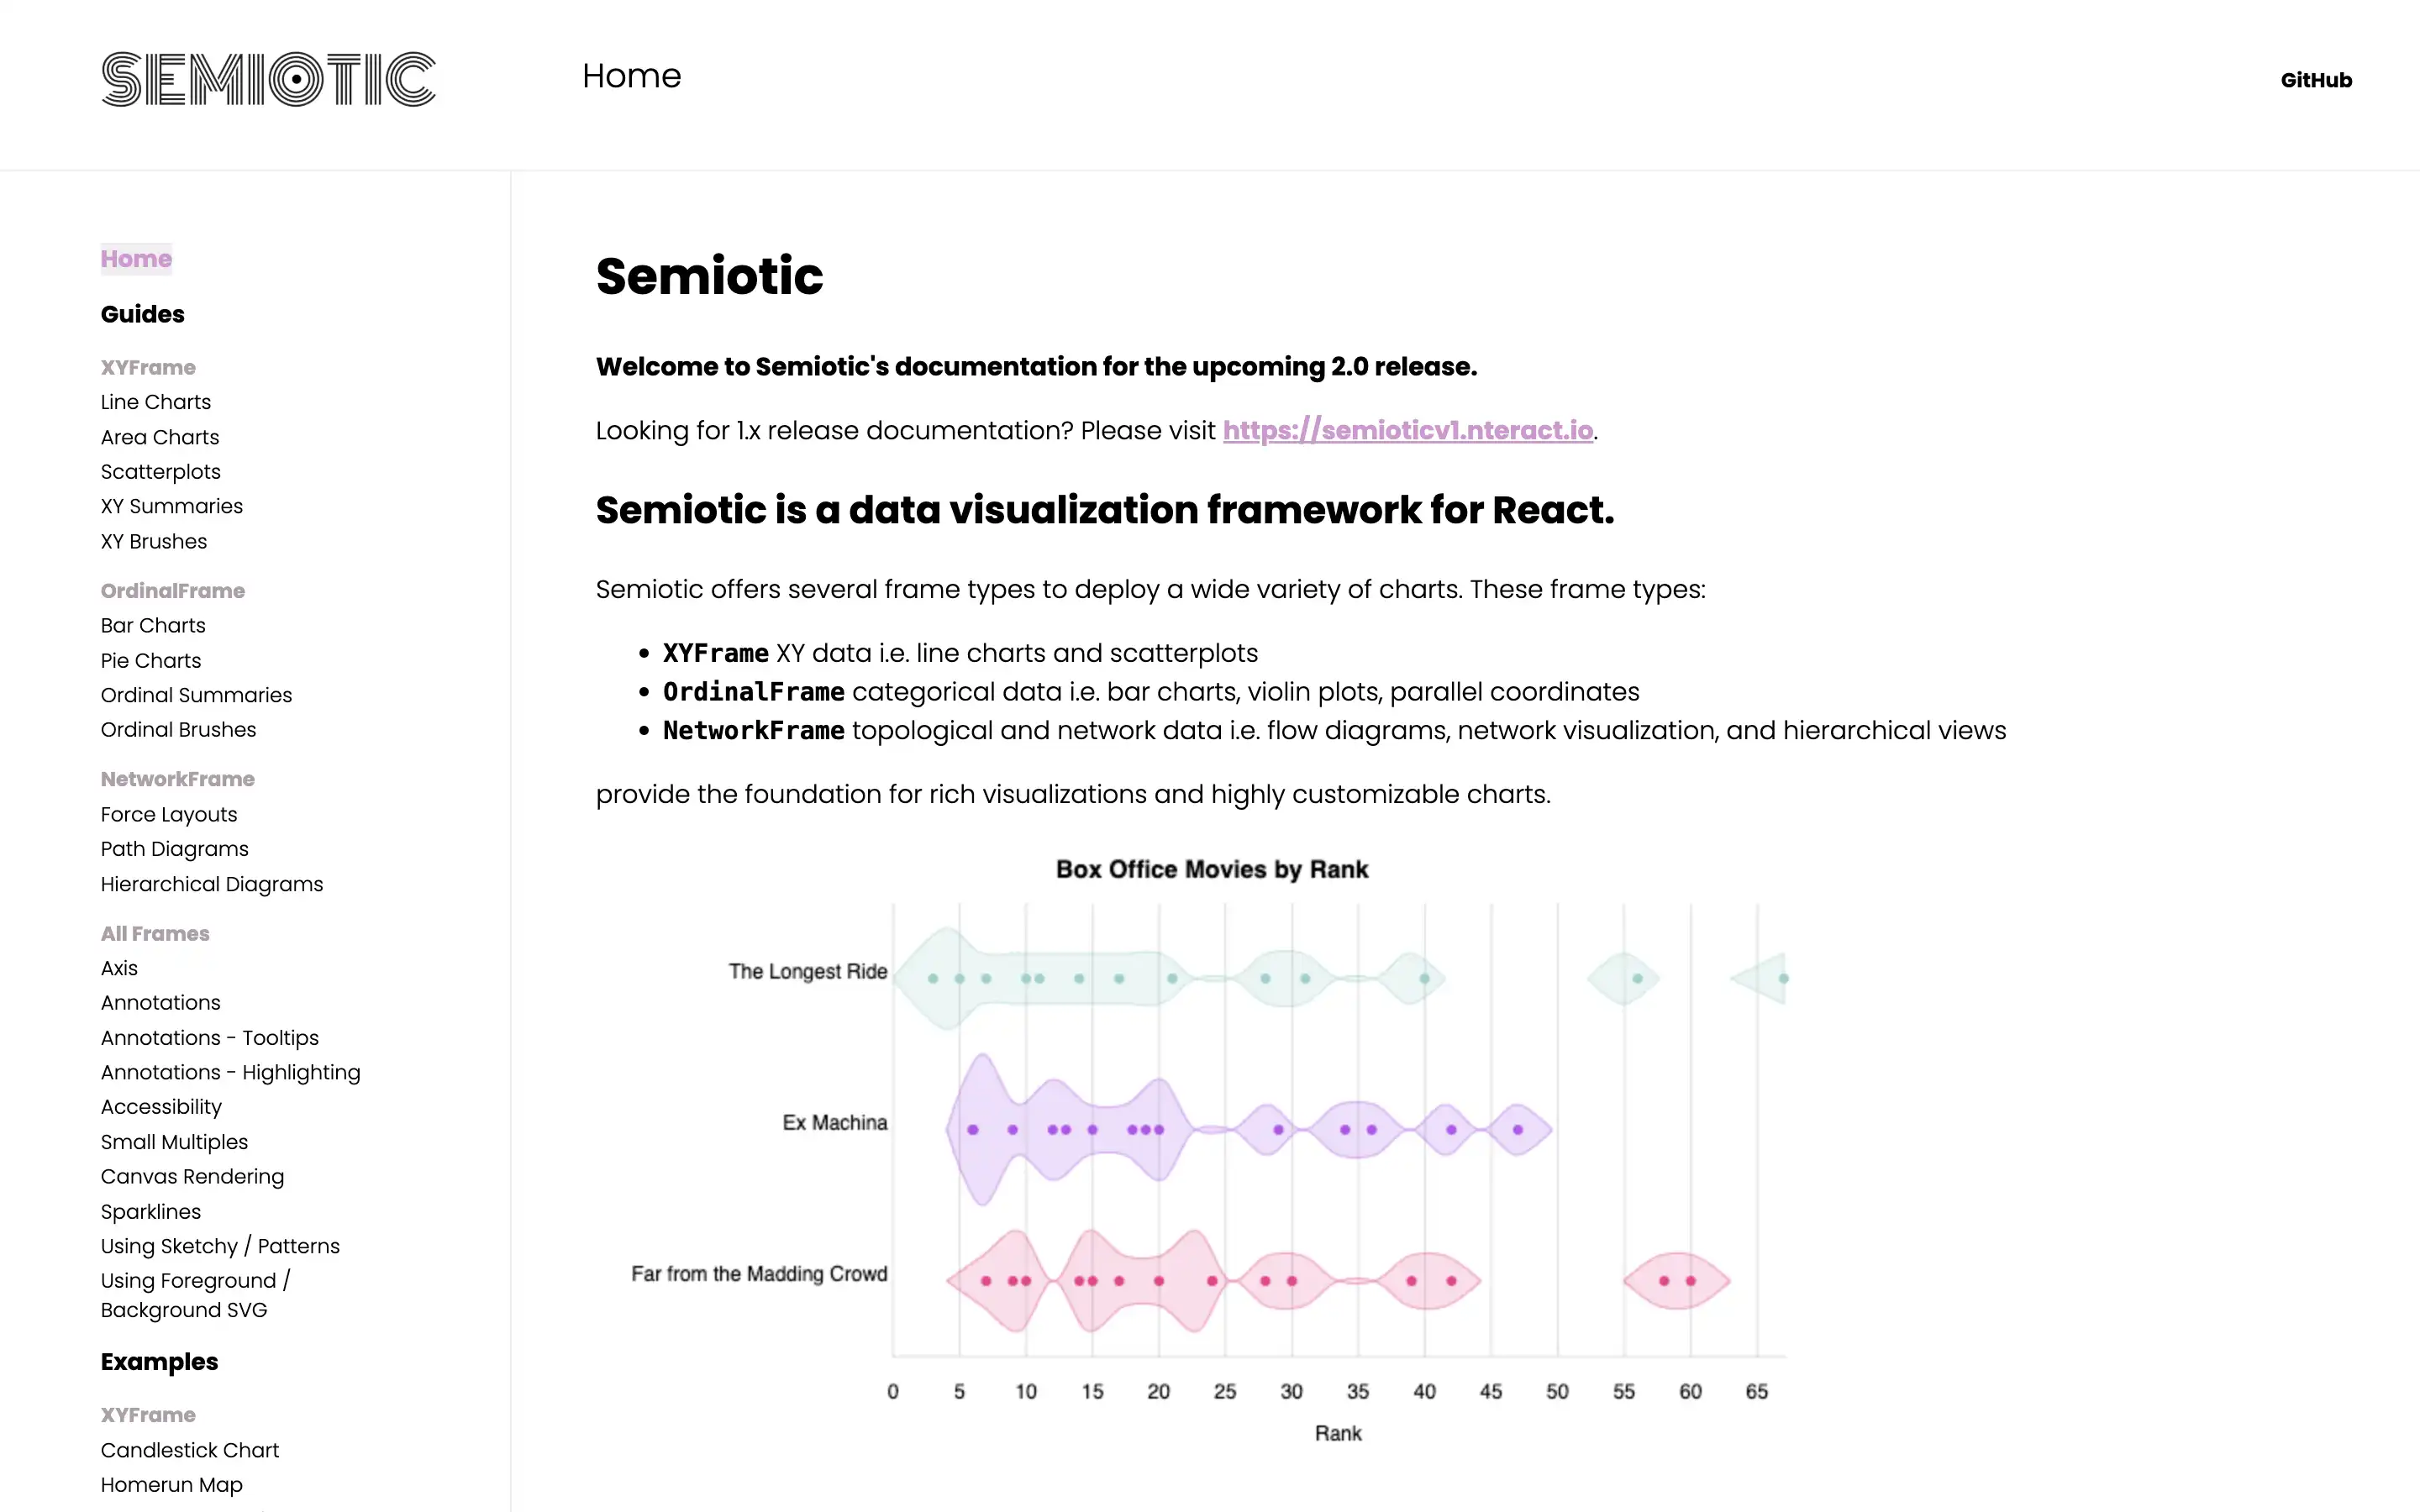
Semiotic is a data visualization framework built for React applications, designed to help developers create interactive charts and graphs with ease. It offers a variety of visualization types, including line charts, area charts, scatterplots, bar charts, and pie charts, enabling the effective representation of complex datasets. The framework is highly customizable, allowing users to adjust visual elements to fit specific needs.
In addition to providing a wide range of chart components, Semiotic supports responsive design and the ability to add annotations, ensuring that visualizations are both informative and adaptable across different devices. With detailed guides and examples on implementing features like path diagrams and uncertainty visualization, Semiotic helps developers create engaging and dynamic data visualizations that enhance the user experience in React-based applications.