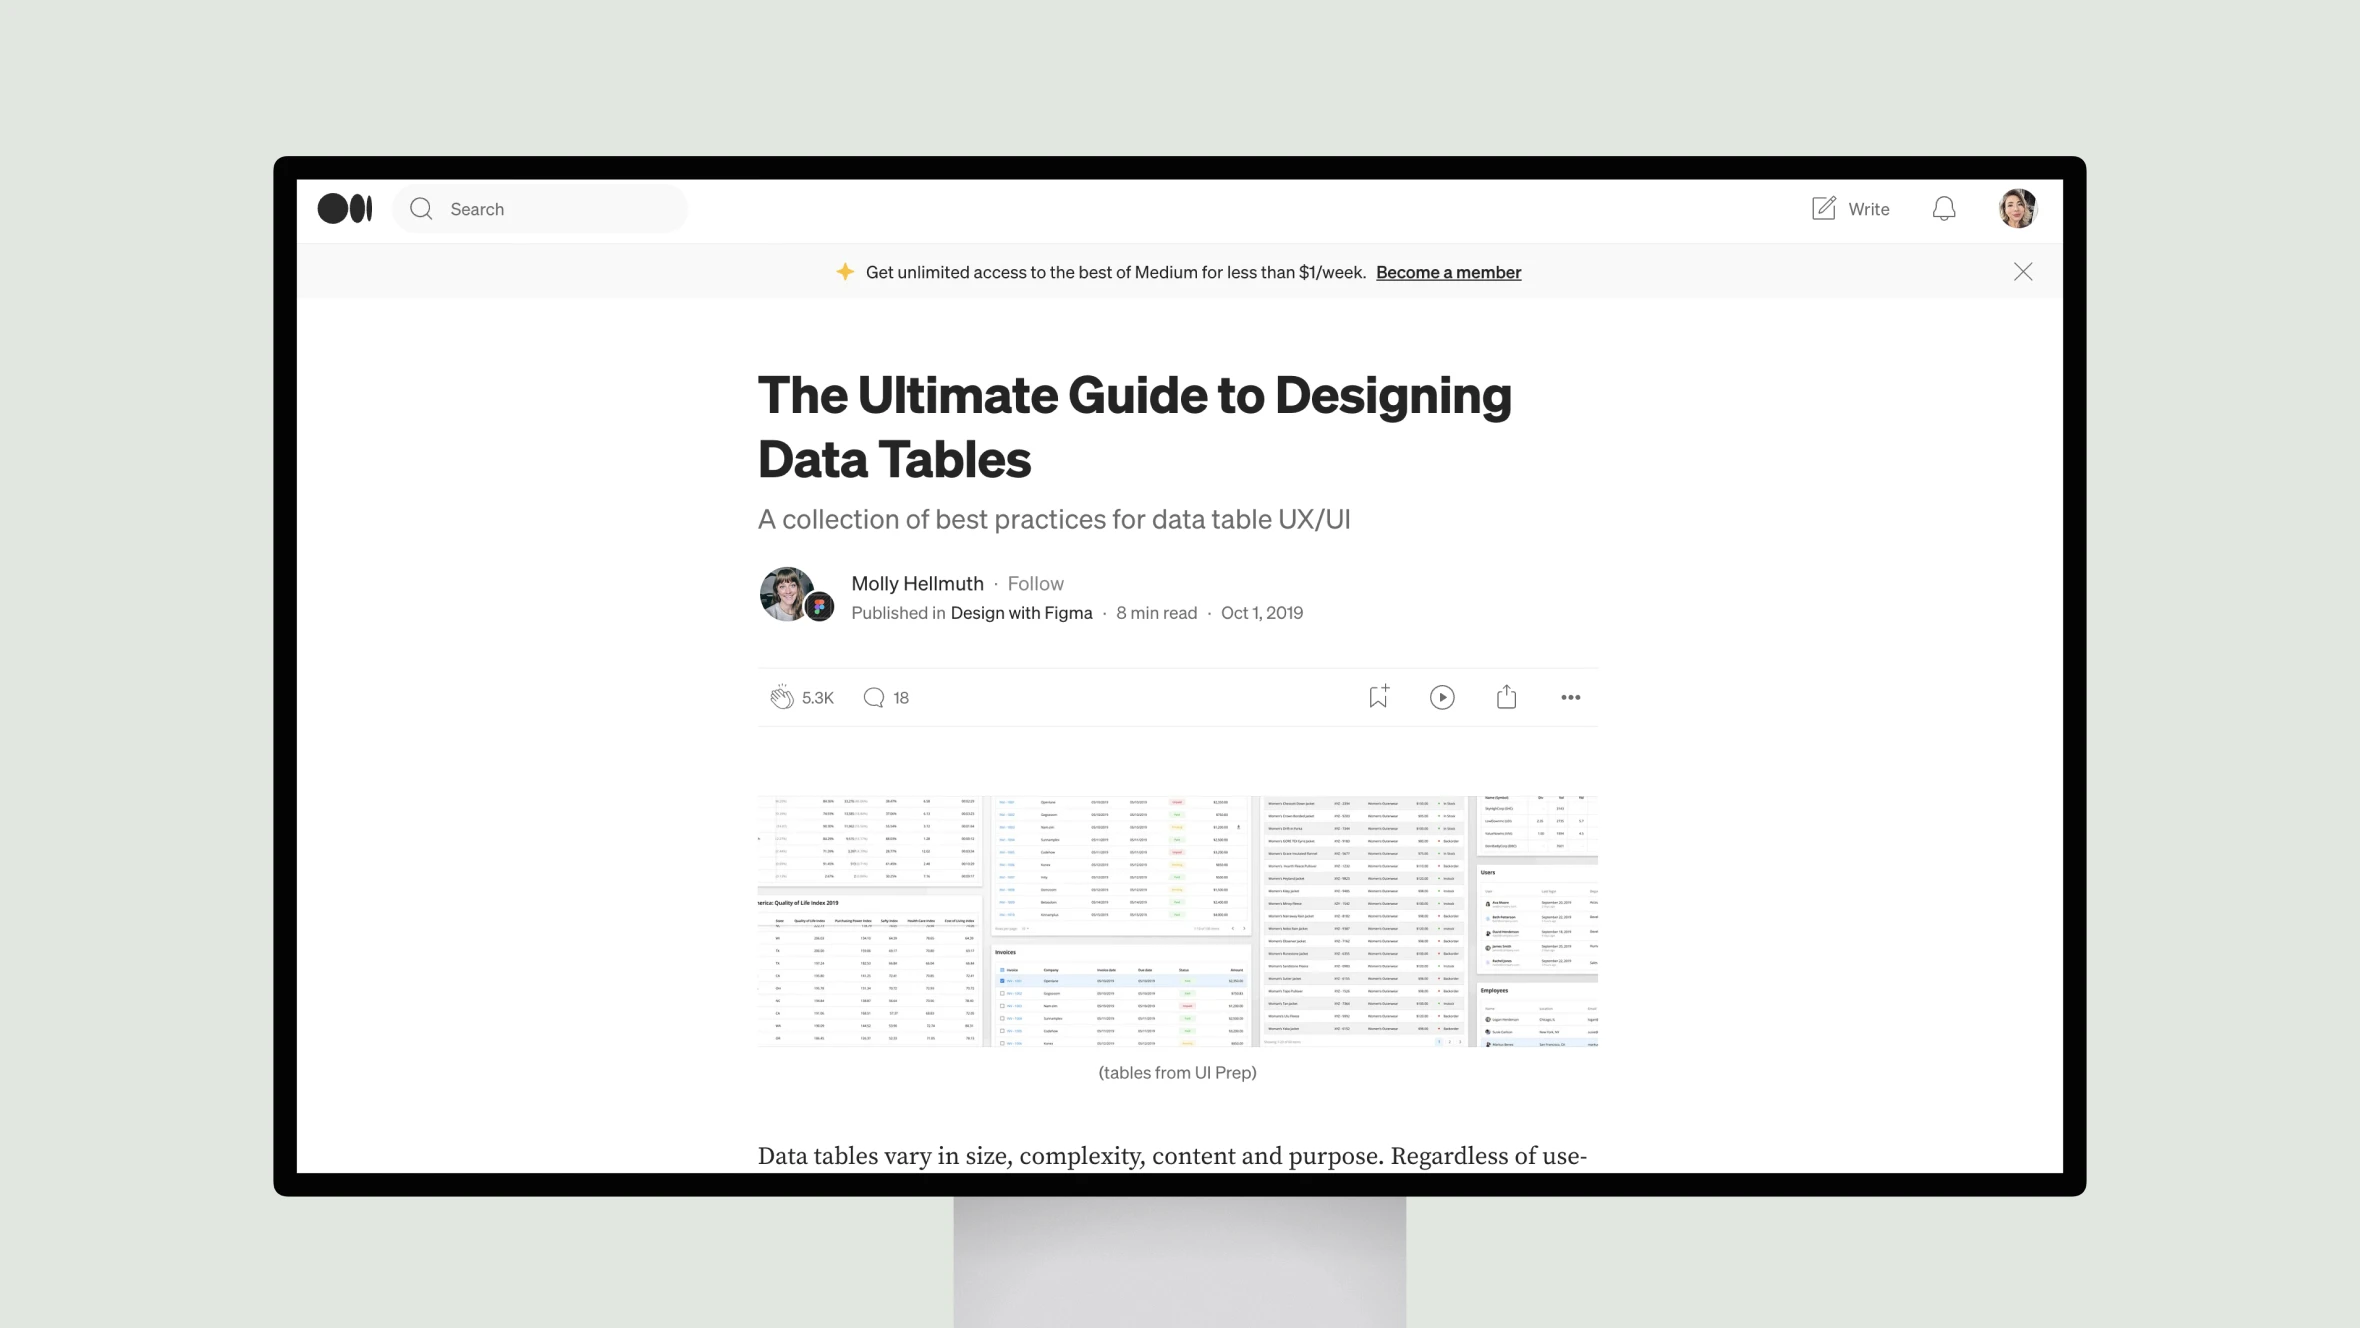
This article provides an in-depth guide to designing practical data tables with best practices for style and functionality. It discusses styling considerations like choosing the appropriate row style, adding visual contrast, and including visual cues. Functional recommendations include maintaining context while scrolling, enabling common actions and data filtering, and customizing the table.
The guide is intended to help designers create clear, readable tables that allow users to easily understand and interact with data. Examples are provided throughout to illustrate each point. The goal is to deliver utility and value to users through well-designed data presentation.


