The article provides clear, data-driven guidance on choosing fonts for data visualization. It explains that sans-serif fonts like Roboto, Lato and Open Sans are easiest to read on screen as they appear clean and allow for quick scanning. Font choice also depends on the need for specific symbols and numbers – lining figures and fonts with full character sets are best. While serif fonts can work for titles to add visual interest, sans-serifs are generally preferred for body text. Factors like font weight, size and case are also important for readability – moderation is key.
Overall this is a thoughtfully researched piece that gives designers the information they need to select typefaces that enhance communication of insights through visuals. Muth’s best practice recommendations are backed by examples from leading publications, making this a go-to reference on an often overlooked but critical aspect of data vis design.
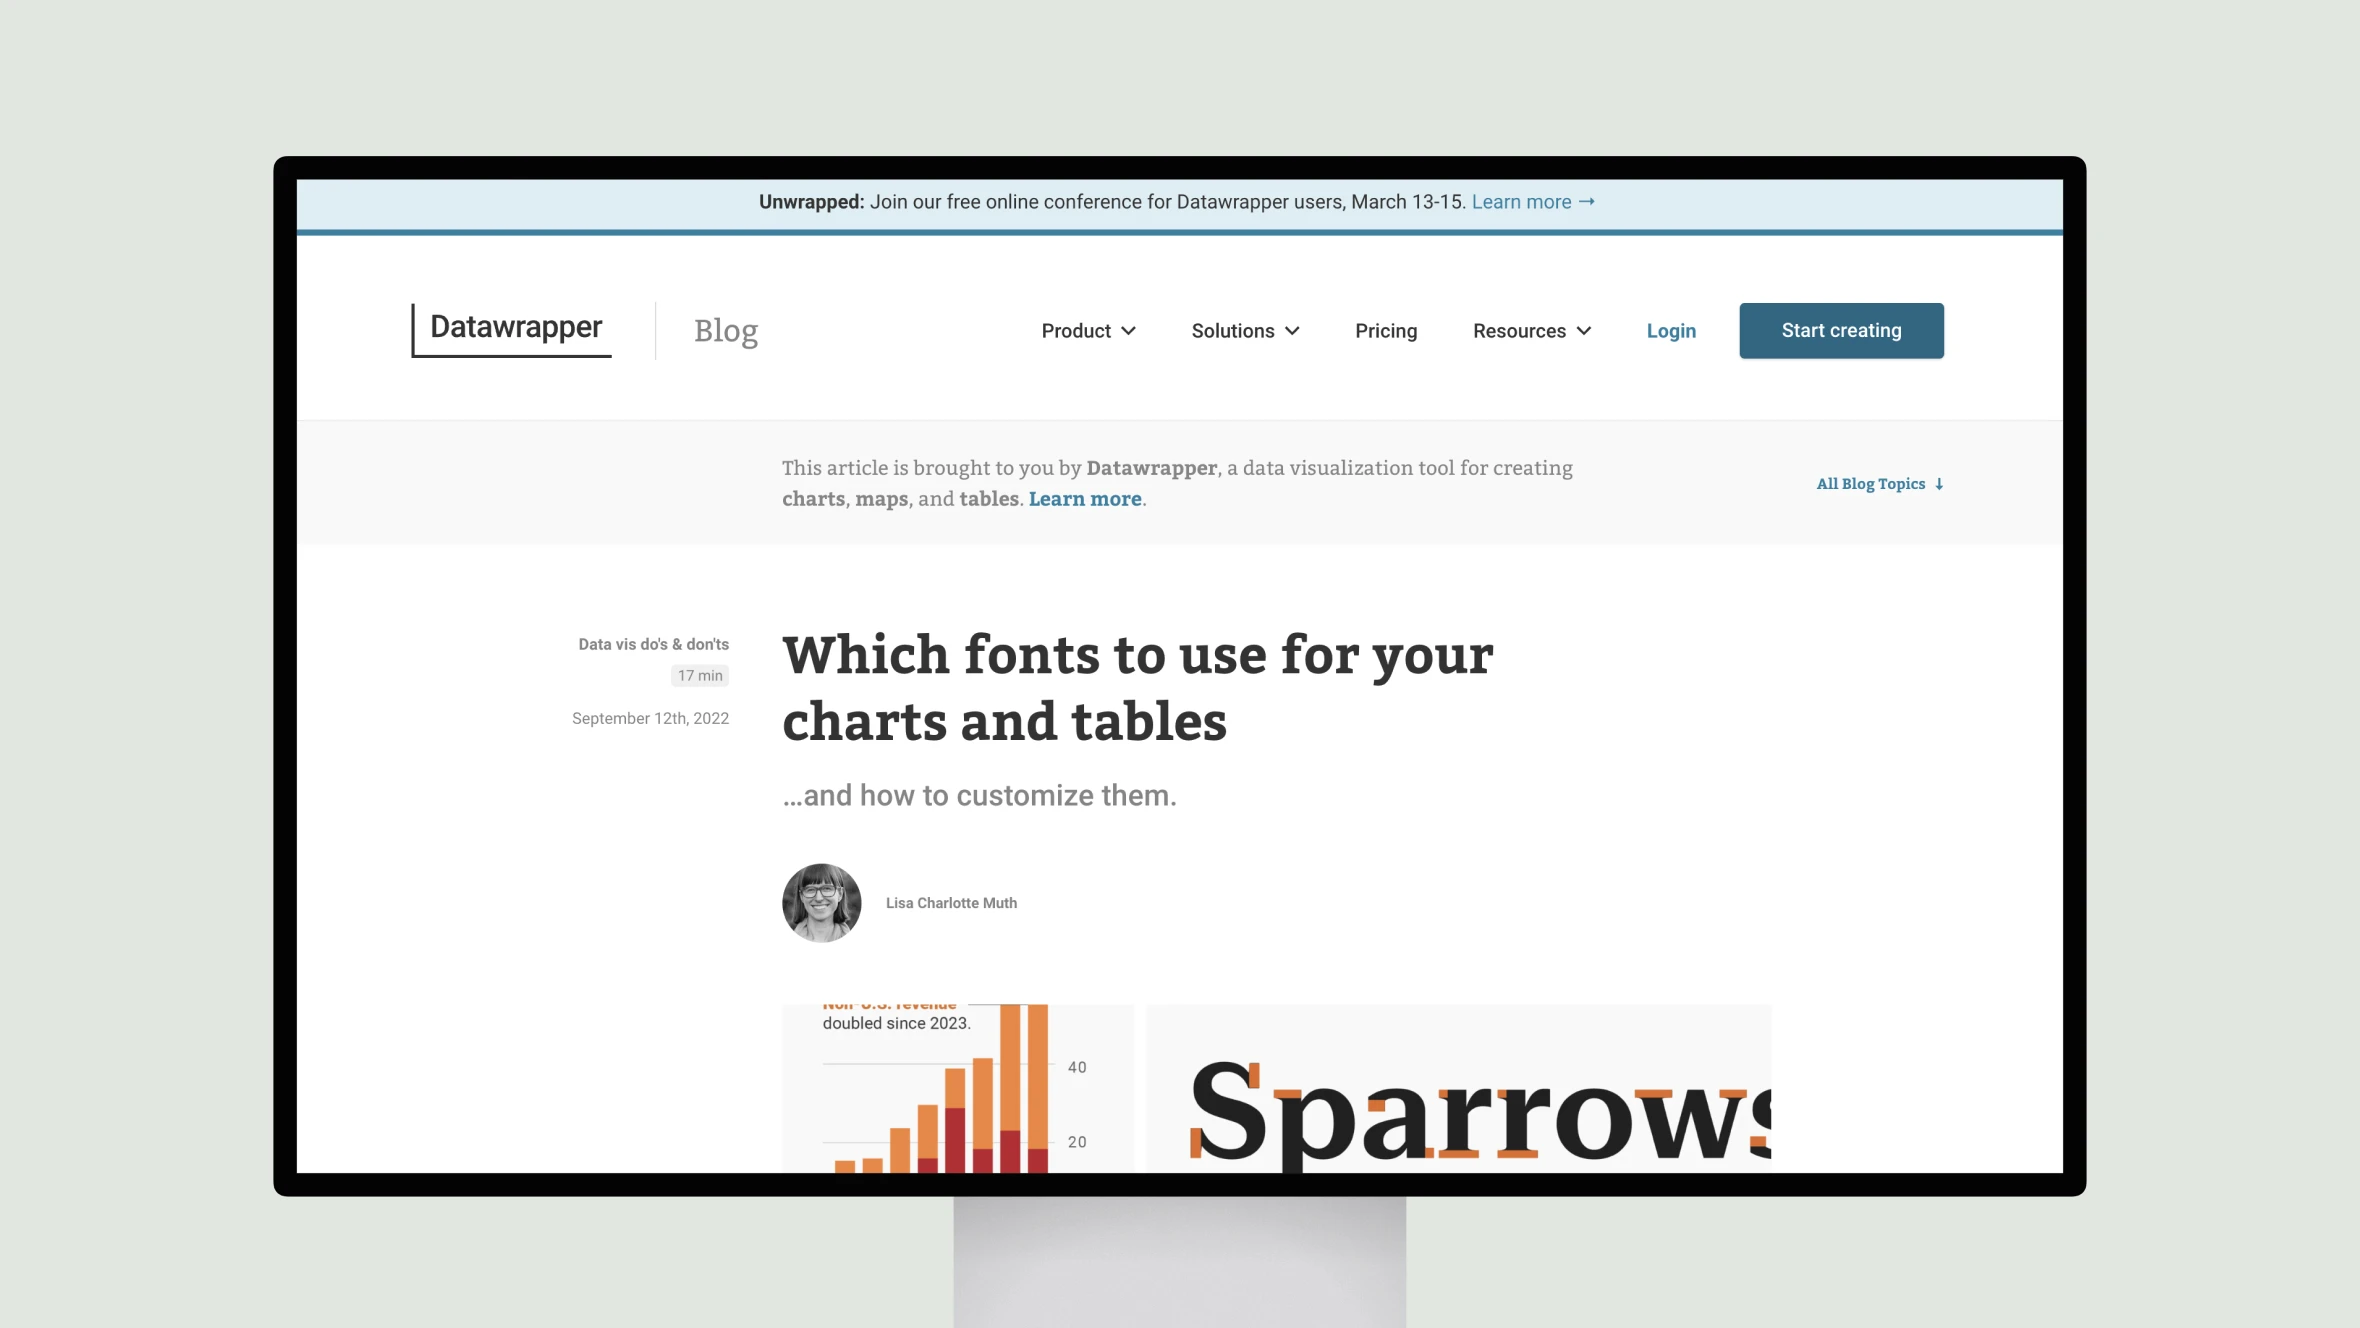
Which fonts to use for your charts and tables
Explore data-driven guidance on font selection for data visualizations, emphasizing sans-serif readability, font weights, sizes, and design best practices.
Topic(s):
Added on:
UI & UX design inspiration for mobile & web apps.