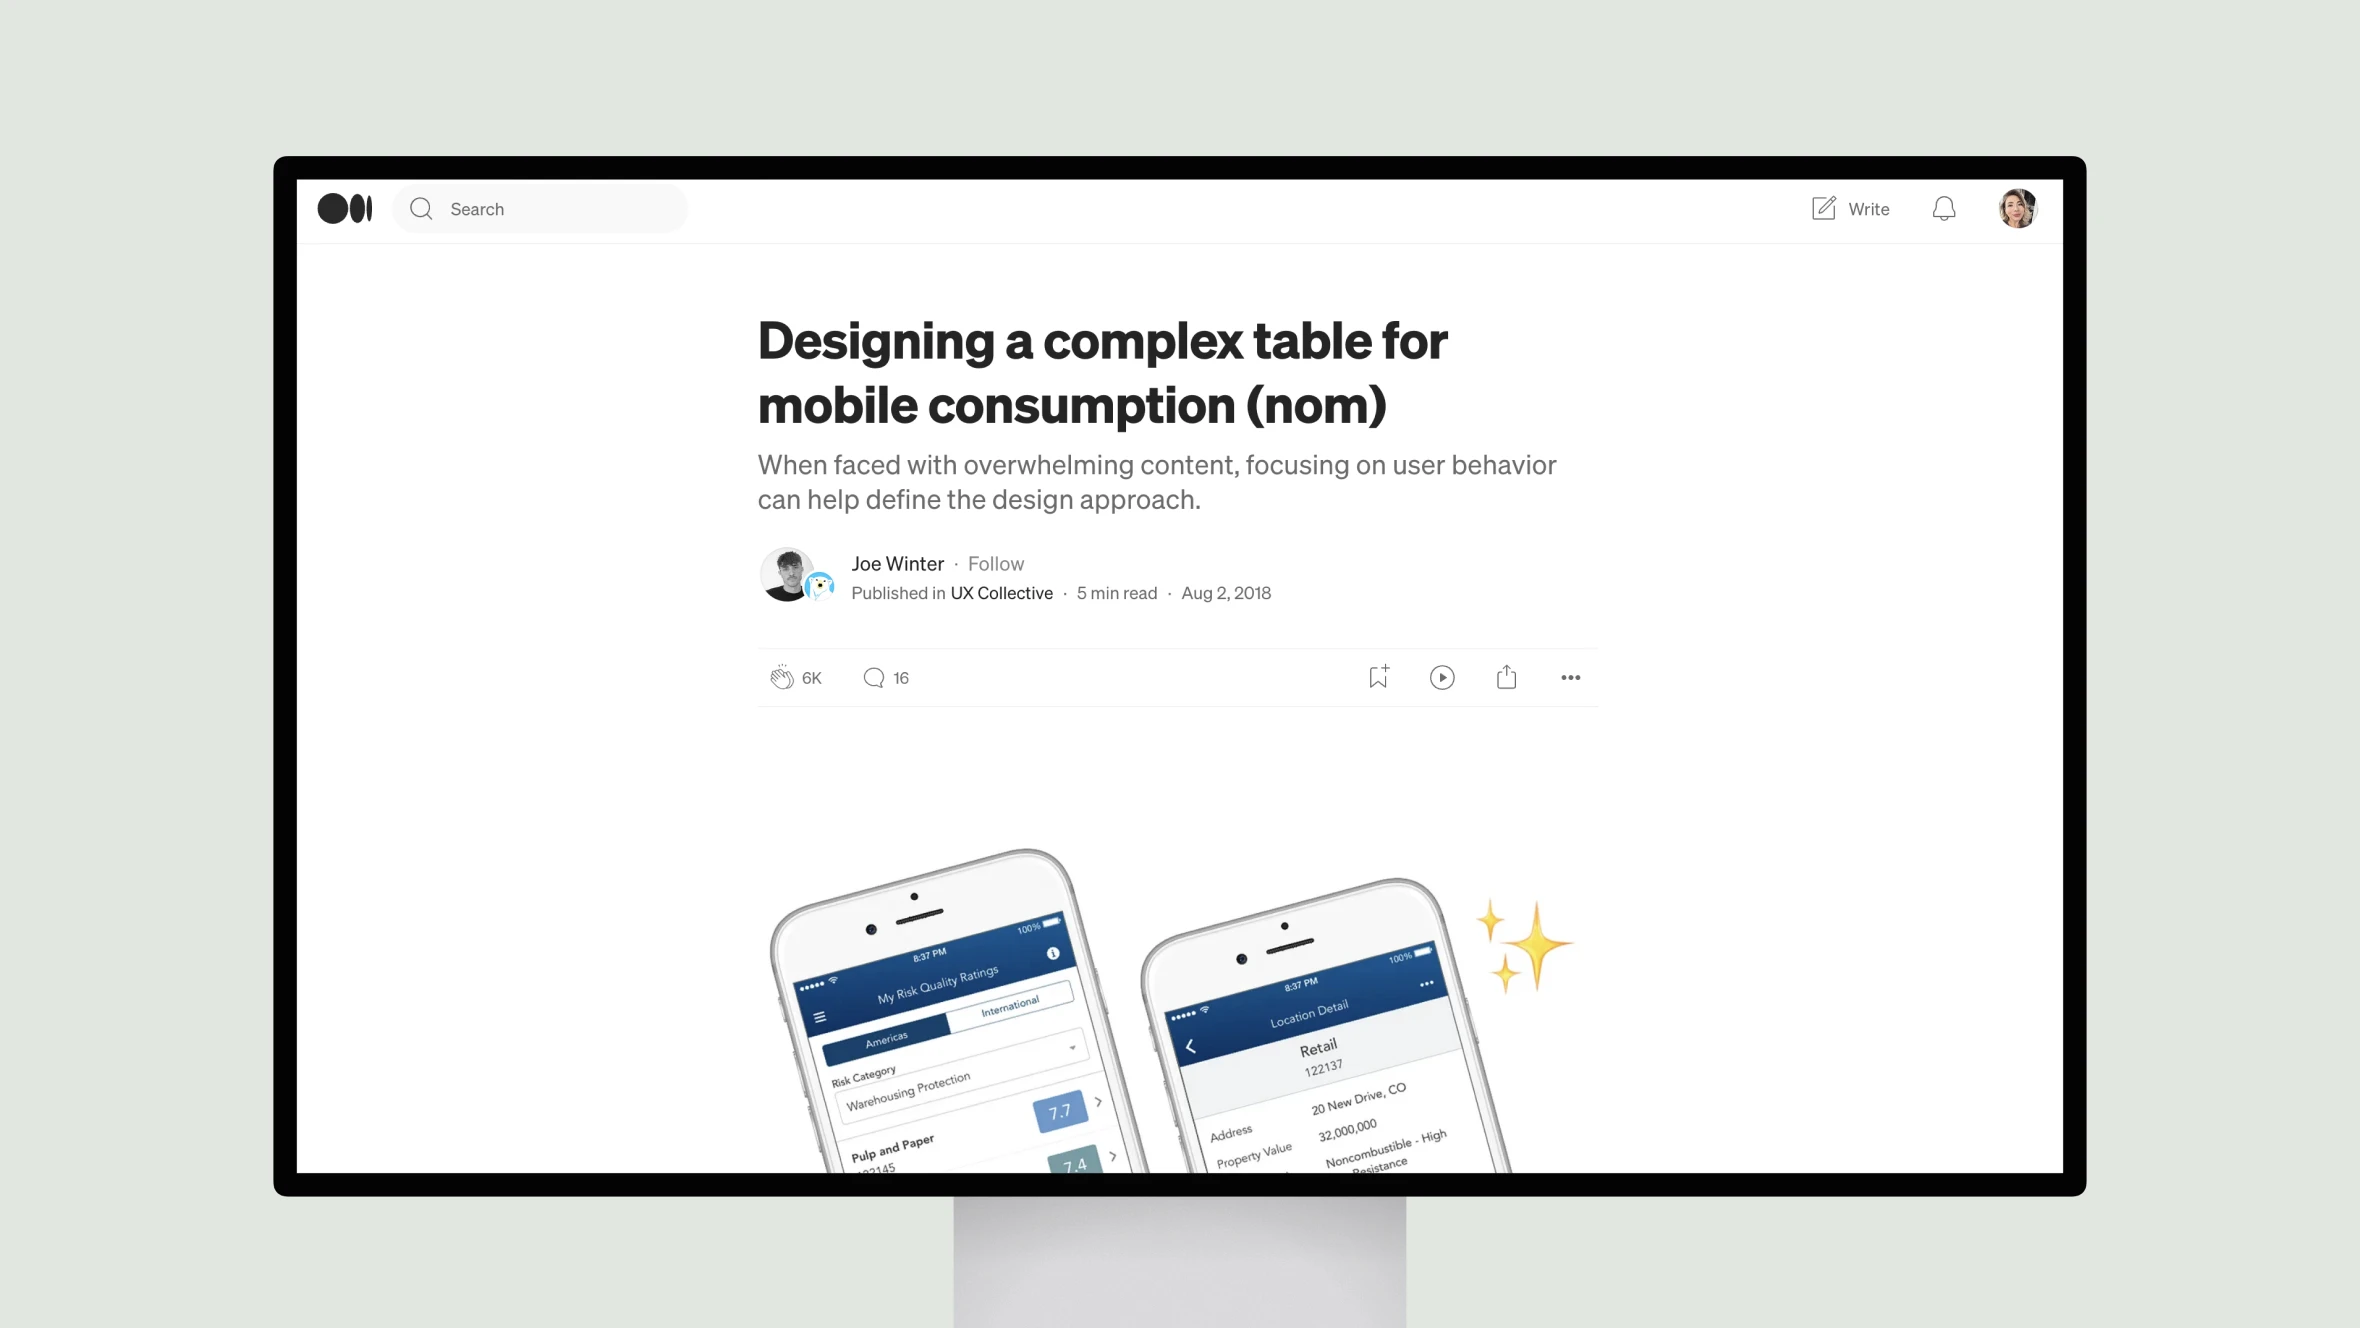
This article discusses the challenges of designing complex data tables for mobile use. It describes a project to mobilize a large table used by property insurance consultants to compare risk factors across multiple locations. The table has 20 rows and 8 columns.
The author takes a user-centered approach, first understanding how consultants typically consume the data. There are two main use cases: comparing a single risk category vertically across locations and multiple categories horizontally within a single location. Based on these use cases, the author designed a “rotating table” mobile interface.