Dashboard design is a crucial aspect of data visualization, as it determines how information is presented and interacted with. This comprehensive guide delves into the various design patterns that can be employed to create effective and user-friendly dashboards.
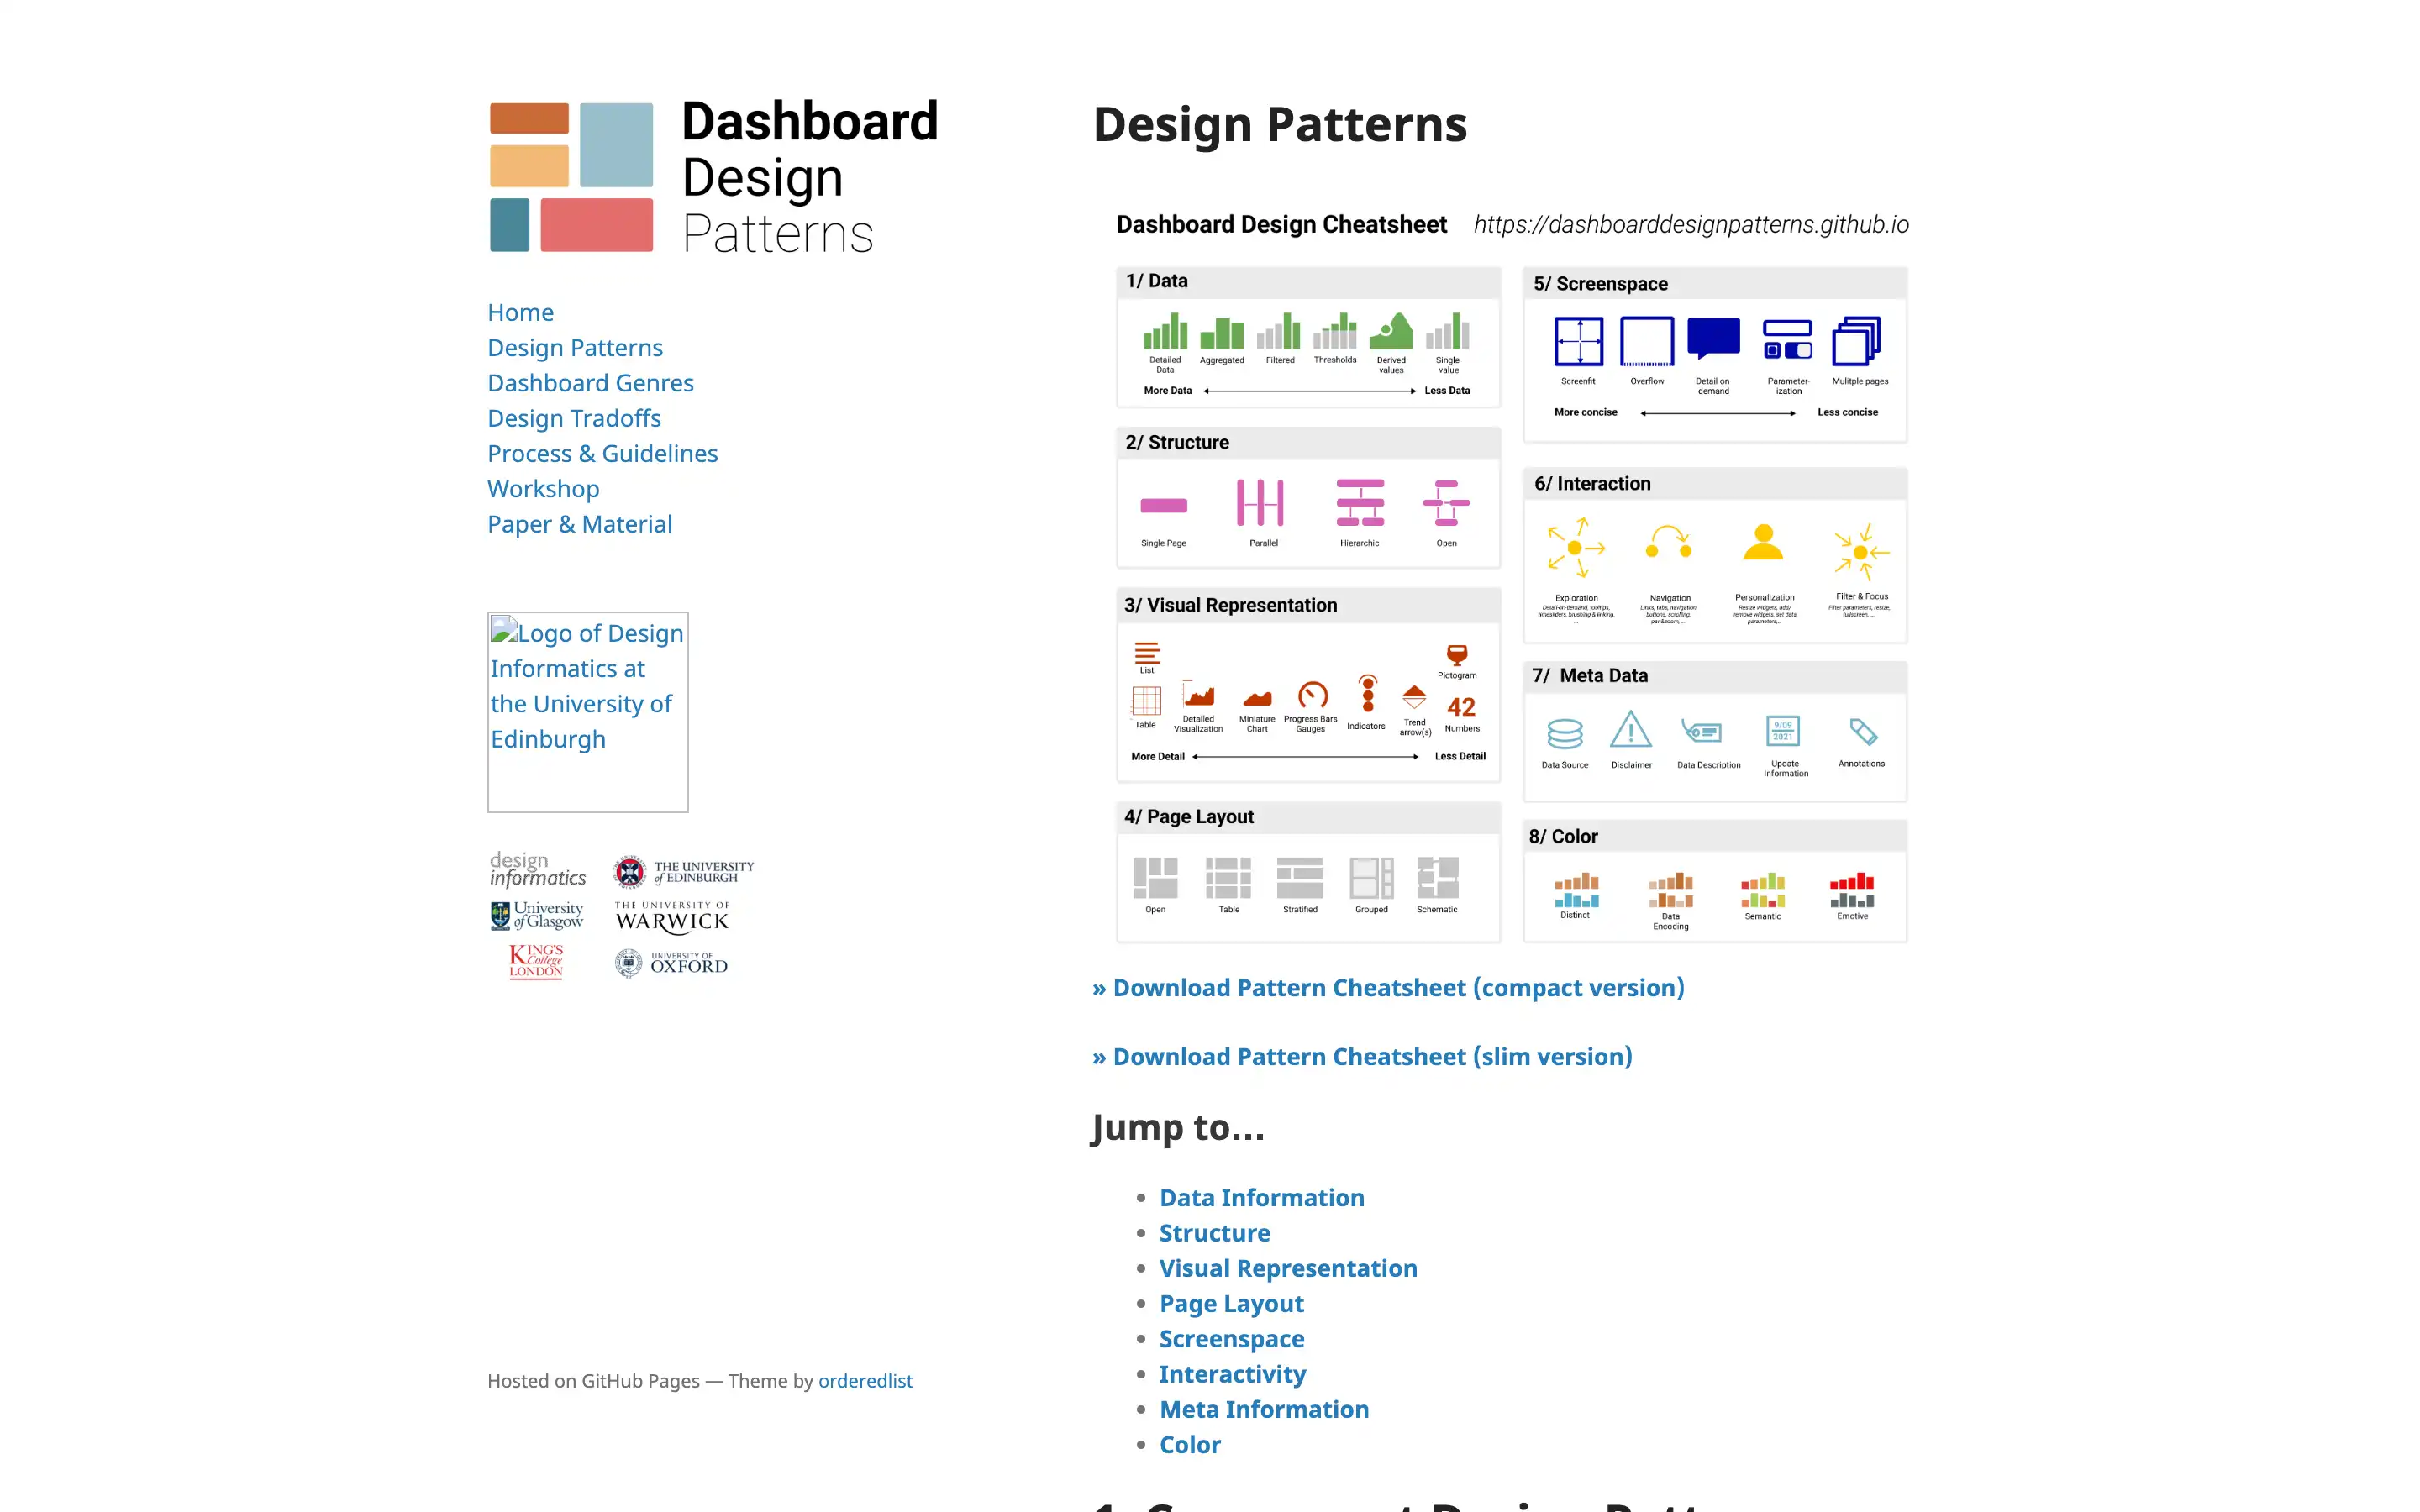
The patterns are organized into several key categories, including data information, meta information, visual representation, page layout, screenspace, interactivity, and color. Each category is explored in depth, with detailed explanations and examples to illustrate the different approaches.
For data information, the patterns range from presenting raw data to various levels of abstraction, such as individual values, derived values, filtered data, thresholds, and aggregated data. Meta information, on the other hand, provides crucial context and explanation about the data, including data sources, disclaimers, descriptions, and updated information.