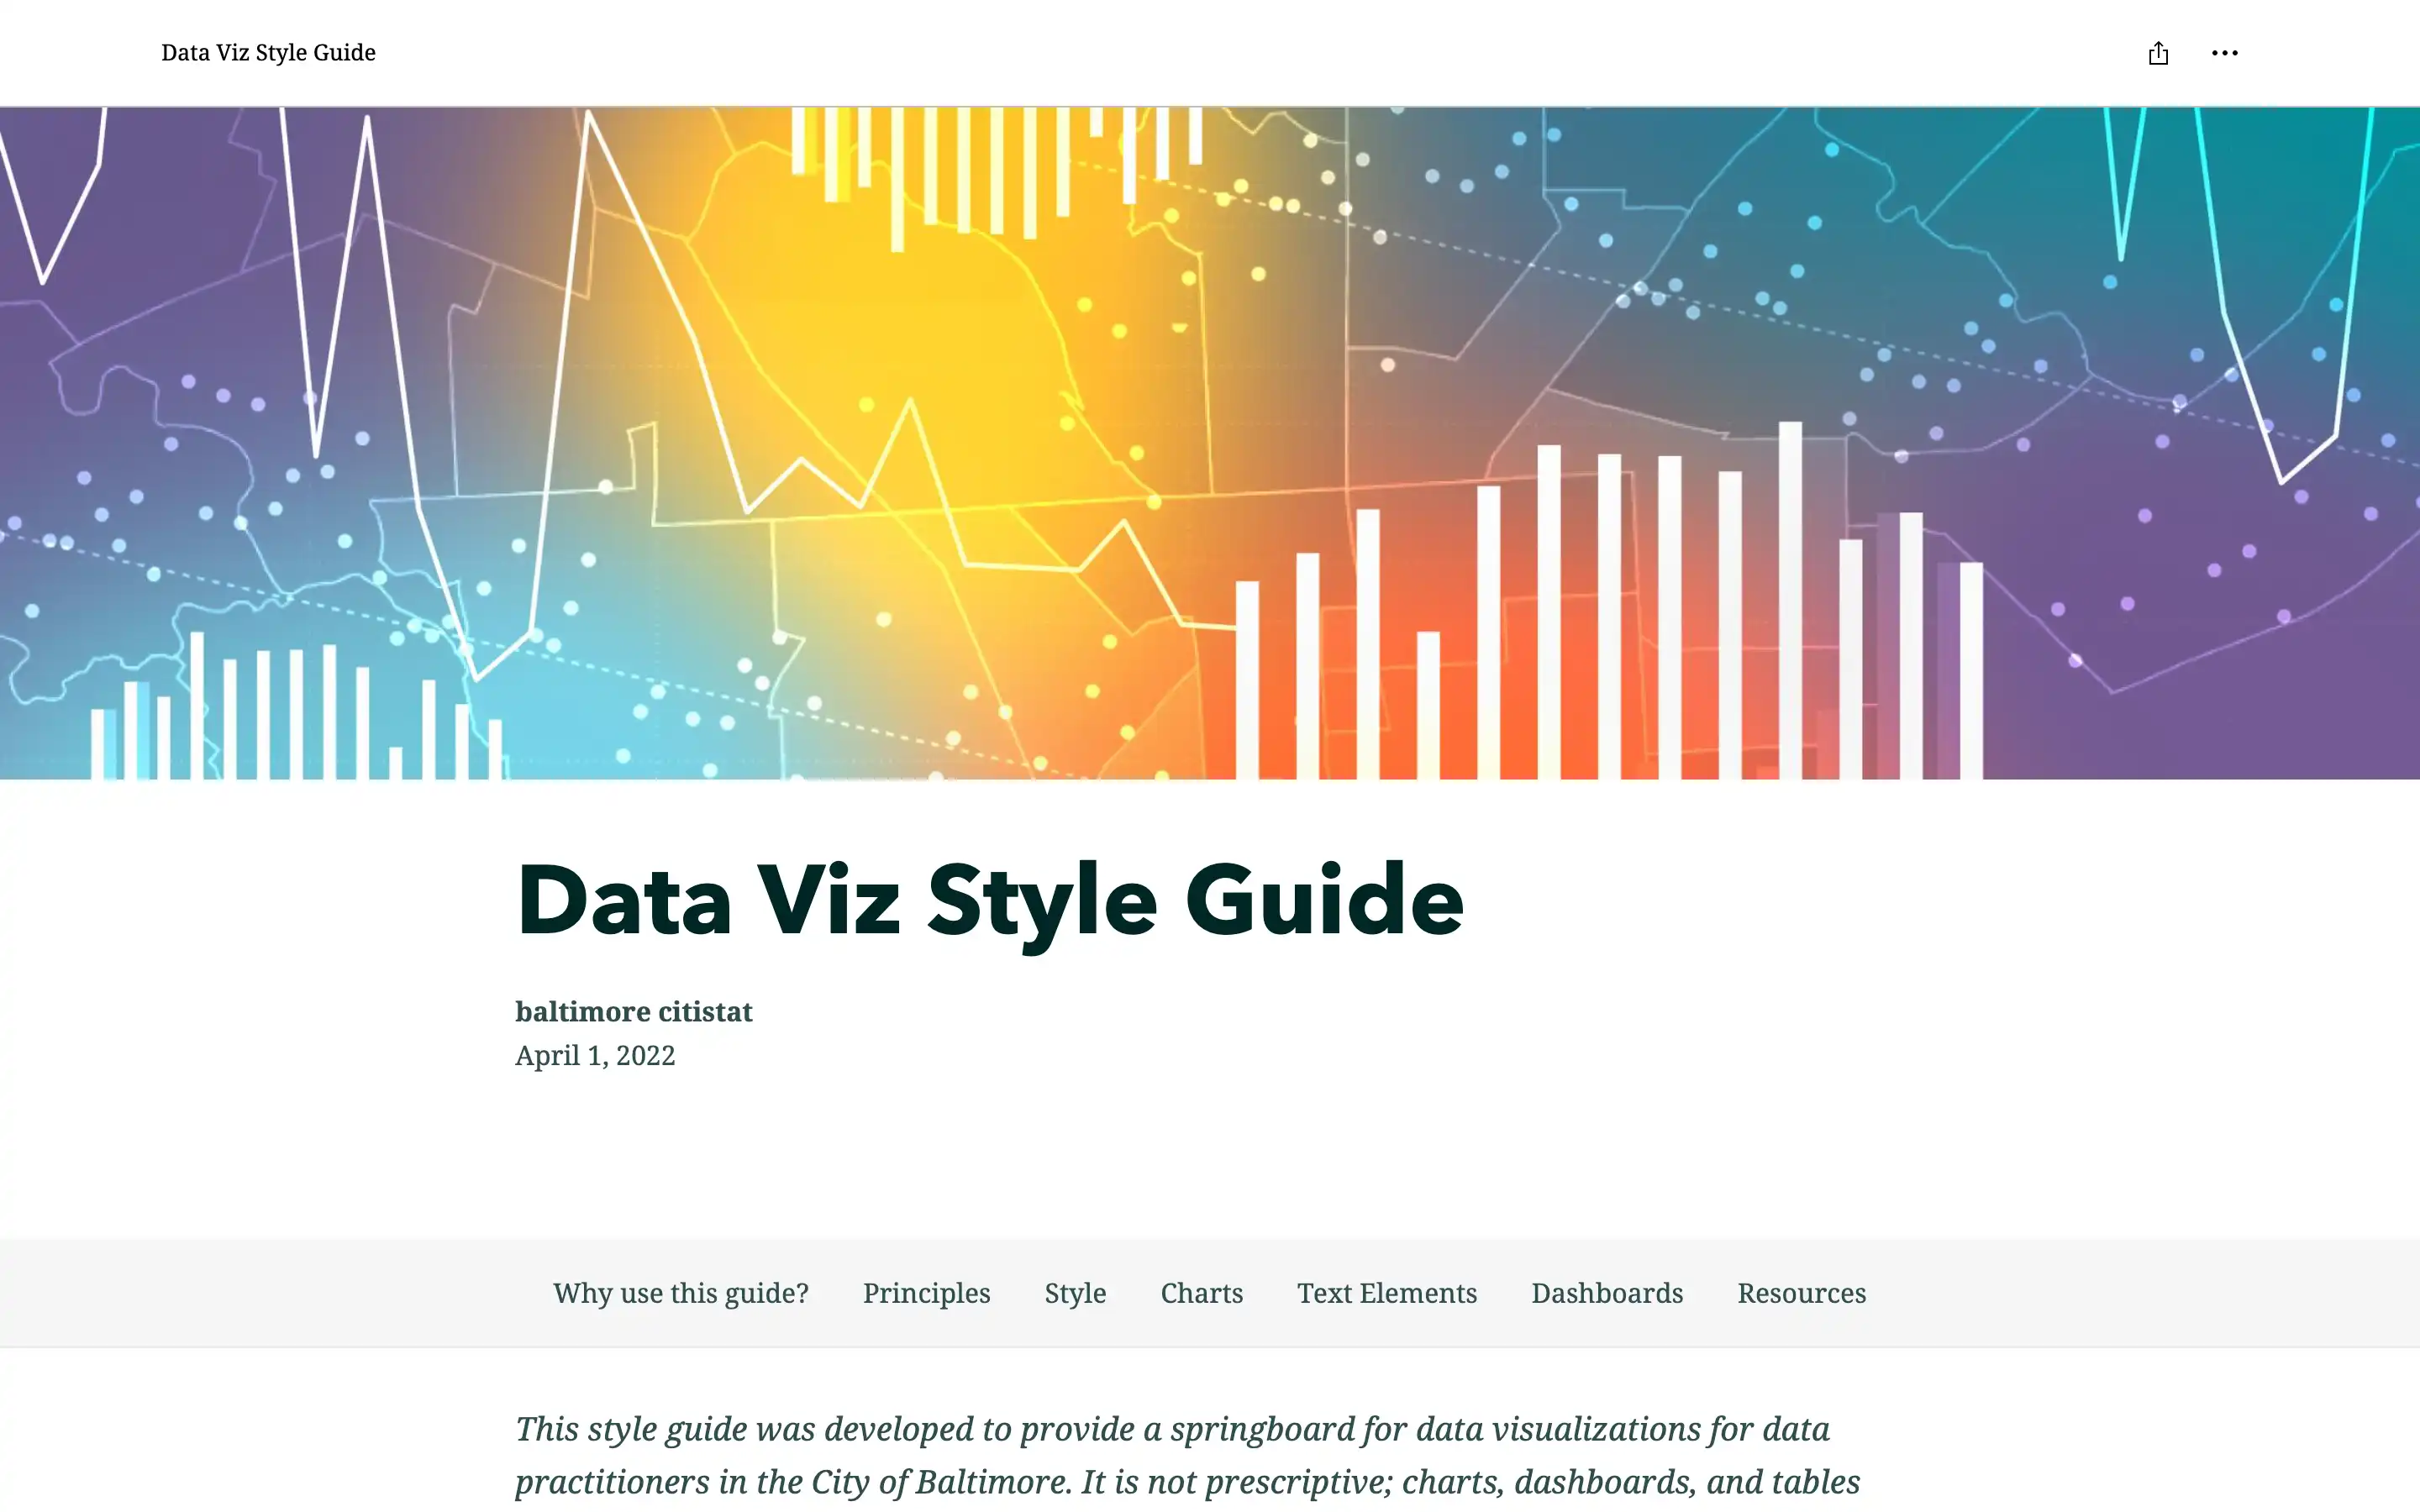
Data Visualization Style Guide was created to improve the quality and accessibility of data visualizations for the City of Baltimore. It provides guidelines on principles such as clarity, accessibility, consistency, and effectiveness, ensuring that data is presented in an accurate and understandable way. The guide emphasizes user-centered design practices, including iterative development and usability testing, to create visual content that meets the needs of diverse audiences.
Detailed sections cover practical recommendations for various chart types, such as line charts, bar charts, scatter plots, and tree maps, offering insights into their appropriate use and design. Accessibility is a key focus, addressing challenges like visual impairments, mobility issues, and cognitive barriers. Additional topics include typography, color selection, and dashboard layouts to enhance visual hierarchy and reader comprehension.