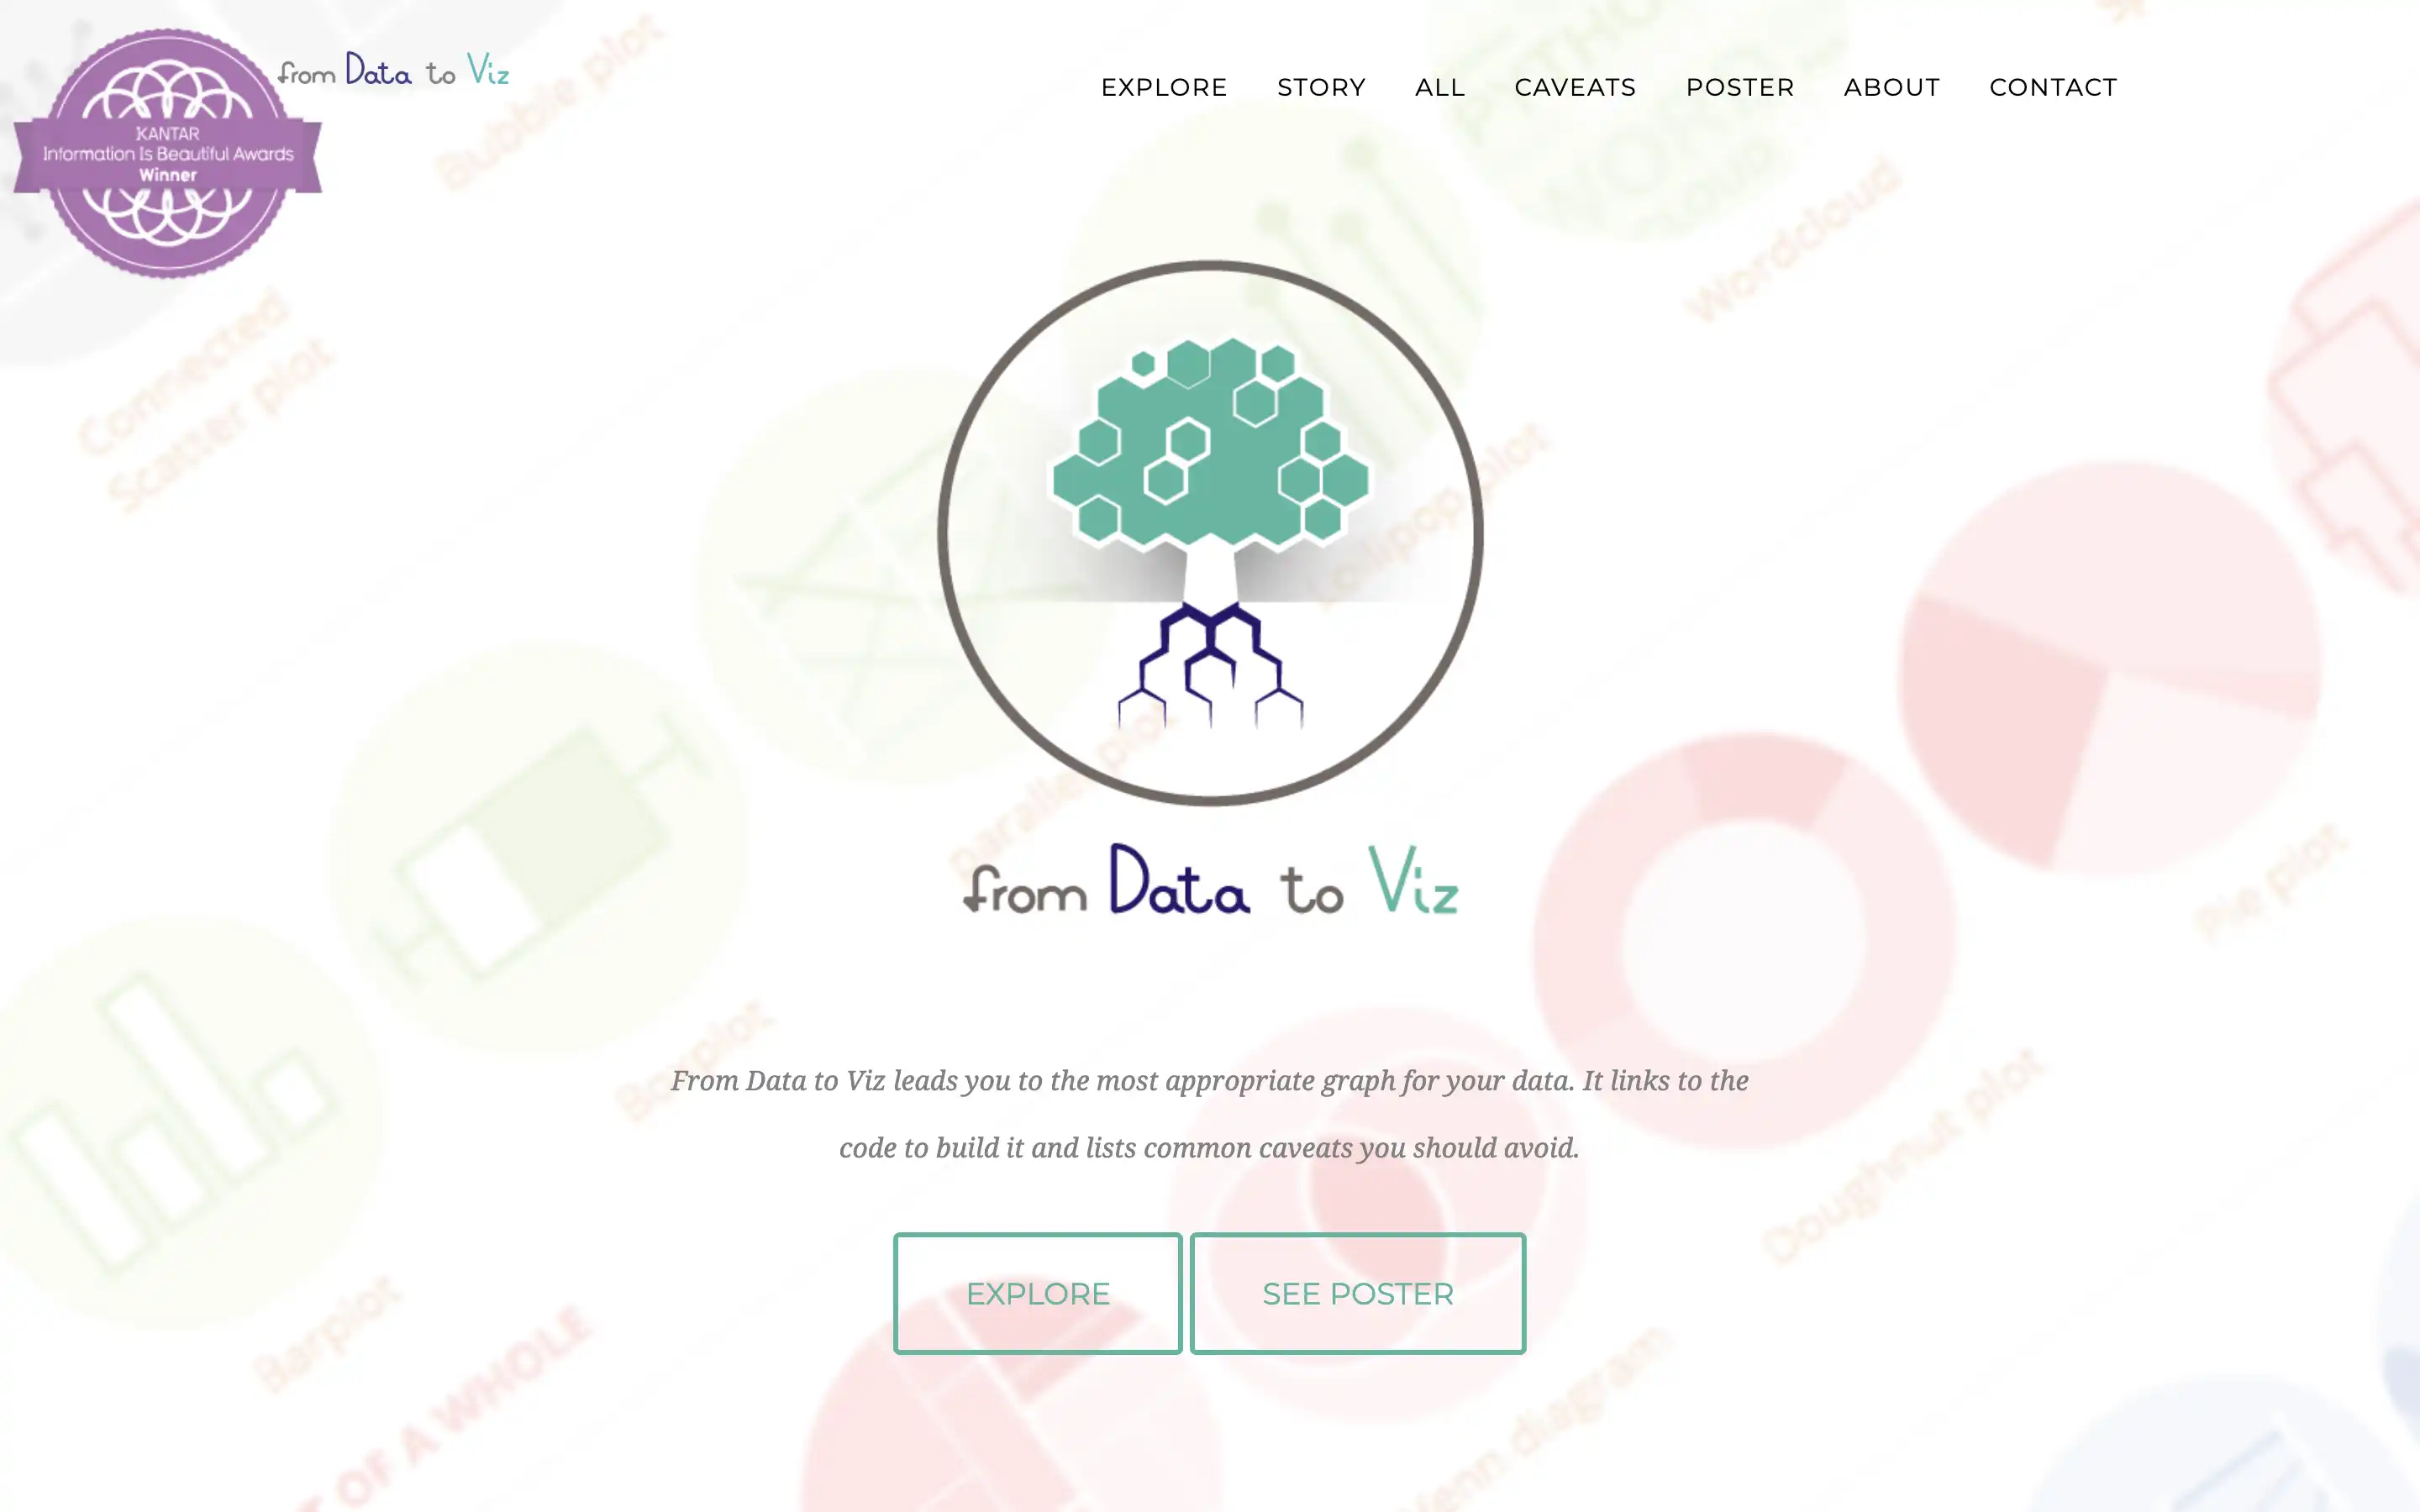
Data to Viz provides a structured approach to data visualization, offering guidance on selecting appropriate chart types based on the nature of datasets and the insights they aim to convey. It explains various visualizations, such as boxplots, and illustrates how they summarize data distribution, including key metrics like medians, quartiles, and outliers. Practical examples accompany each chart type, clarifying when and how to use them effectively.
The resource also highlights considerations for designing clear and accessible visualizations, focusing on factors like data interpretation, audience needs, and storytelling goals.