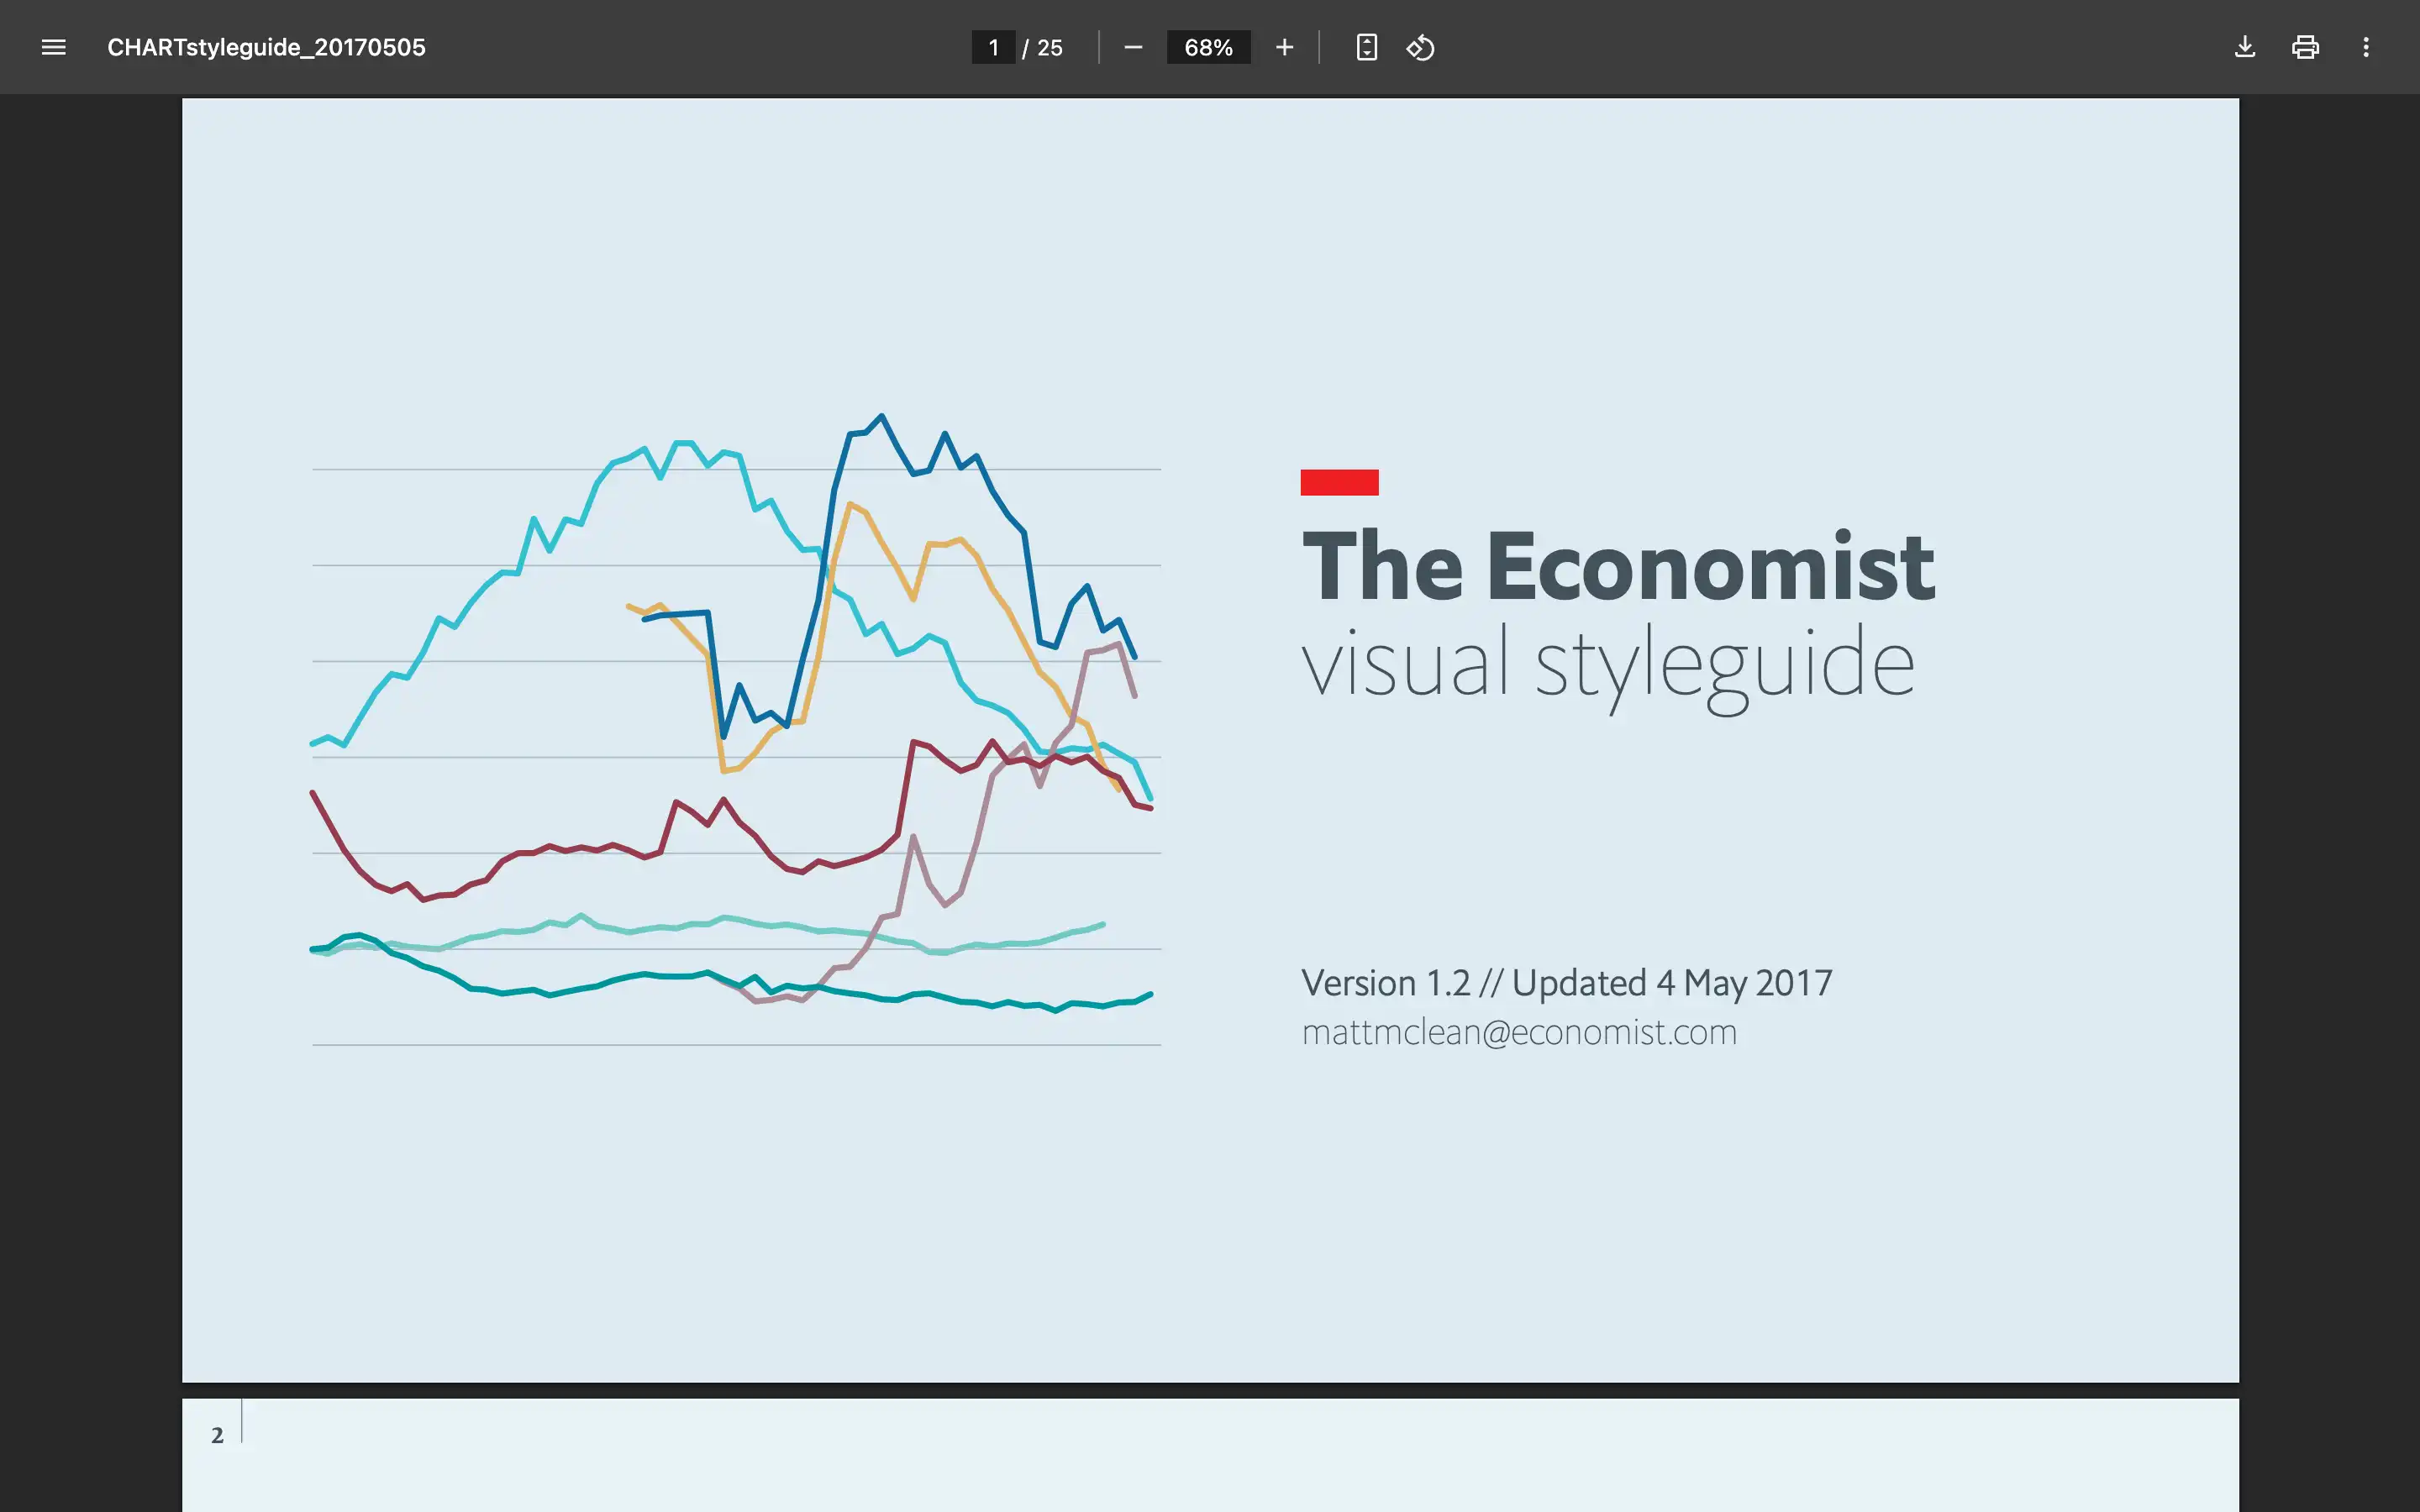
The Economist Visual Style Guide outlines a framework for designing charts and graphics that meet clarity, accuracy, and visual consistency standards. The guide focuses on presenting data in a way that is accessible to audiences while maintaining the integrity of the information. It guides selecting appropriate chart types, scaling proportions, and using typography and colors to enhance readability.
The guide also emphasizes consistency across visual outputs and includes detailed recommendations for labeling, gridlines, and data sourcing. Adhering to these principles supports teams in creating data visualizations that align with professional design and editorial standards.