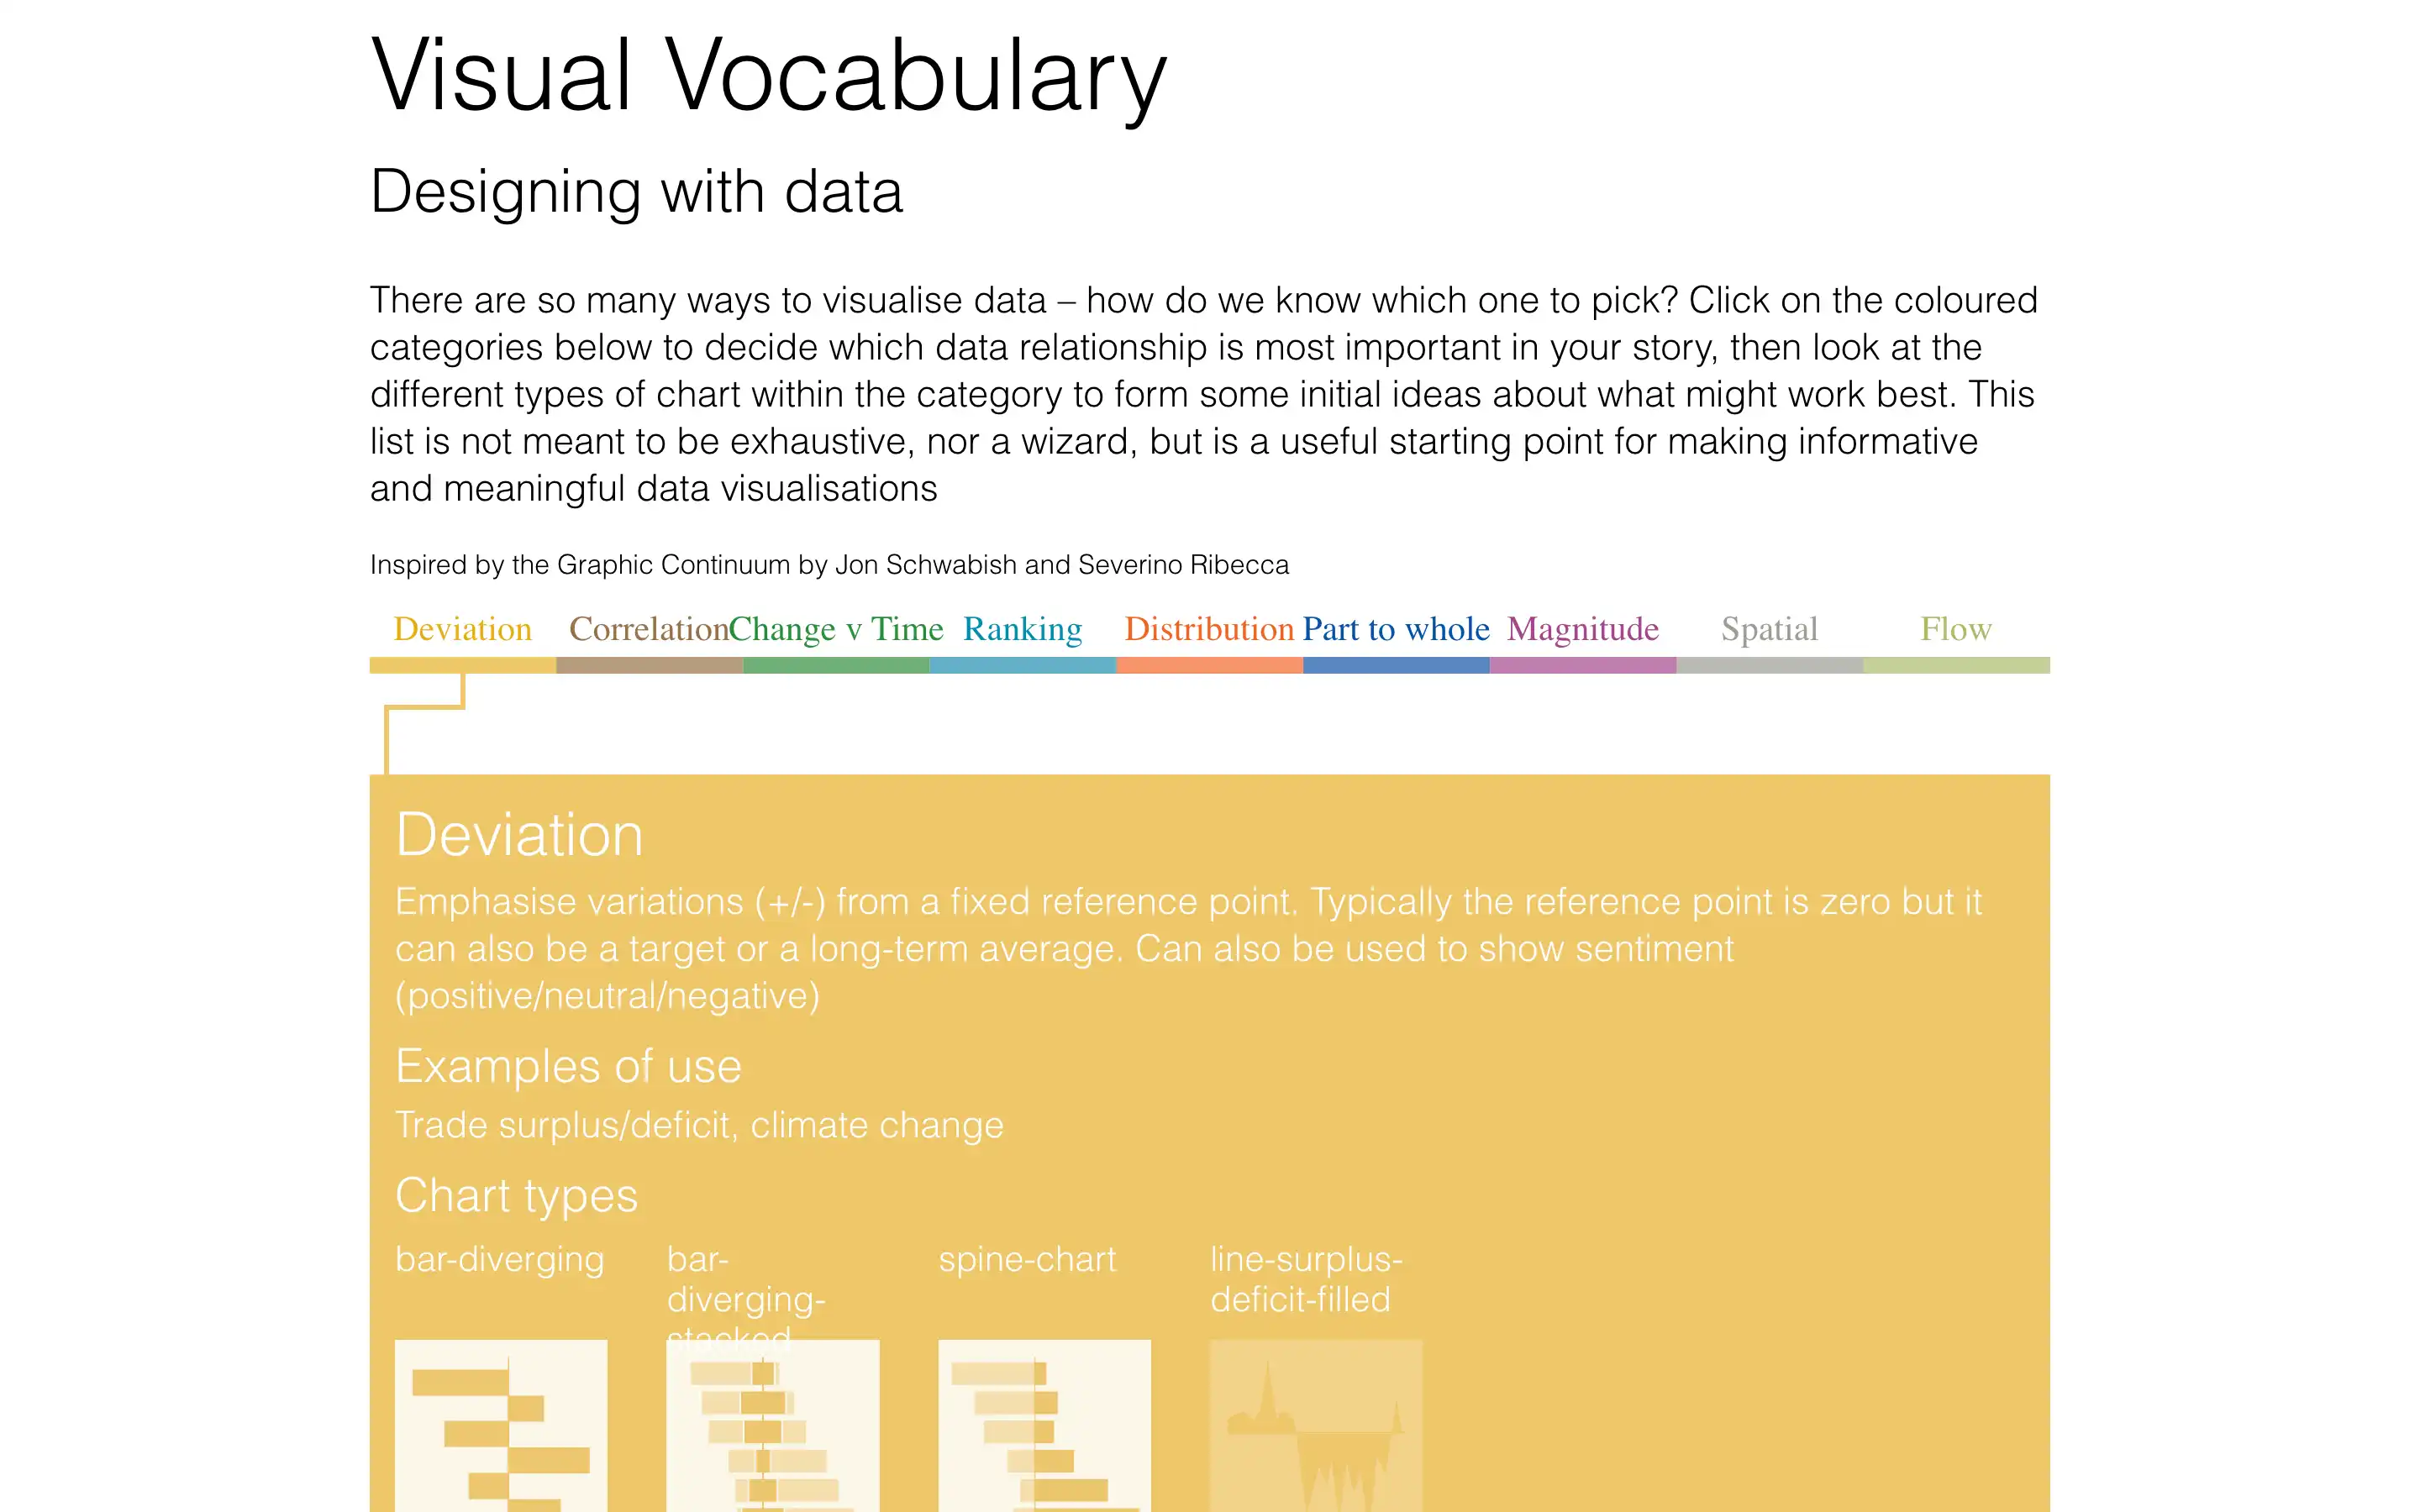
Visual Vocabulary, created by FT Interactive, helps users choose the best chart types for data visualization. It offers a clear and structured framework, guiding users—such as data journalists, analysts, and designers—through selecting the right visual representation based on the type of data and the story they want to convey. The resource categorizes charts according to their fit for different data relationships, like comparisons, distributions, or trends, making it easier to navigate and apply.
One of the main features is the interactive chart chooser, which acts as a decision-making tool. Users can explore various data scenarios and quickly find the most suitable visualization method. The guide also provides practical examples and best practices, ensuring the framework is backed by real-world applications. By grouping similar chart types and offering clear explanations, the resource flows logically, making it accessible even to those new to data visualization.