Text is an underutilized but essential element of any data visualization. This article provides best practices for using text effectively to ensure readers easily understand charts, maps, and other visuals.
Key recommendations include labeling elements directly rather than using separate legends, repeating units and categories in axis labels and tooltips, limiting font sizes for readability, and using annotations to emphasize important details. Text should be designed with the reader in mind by placing information where it’s needed, leading with impactful phrasing and conversational language before precision.
Overall, following these guidelines will make any data visualization clearer, more scannable and enjoyable to consume for all audiences.
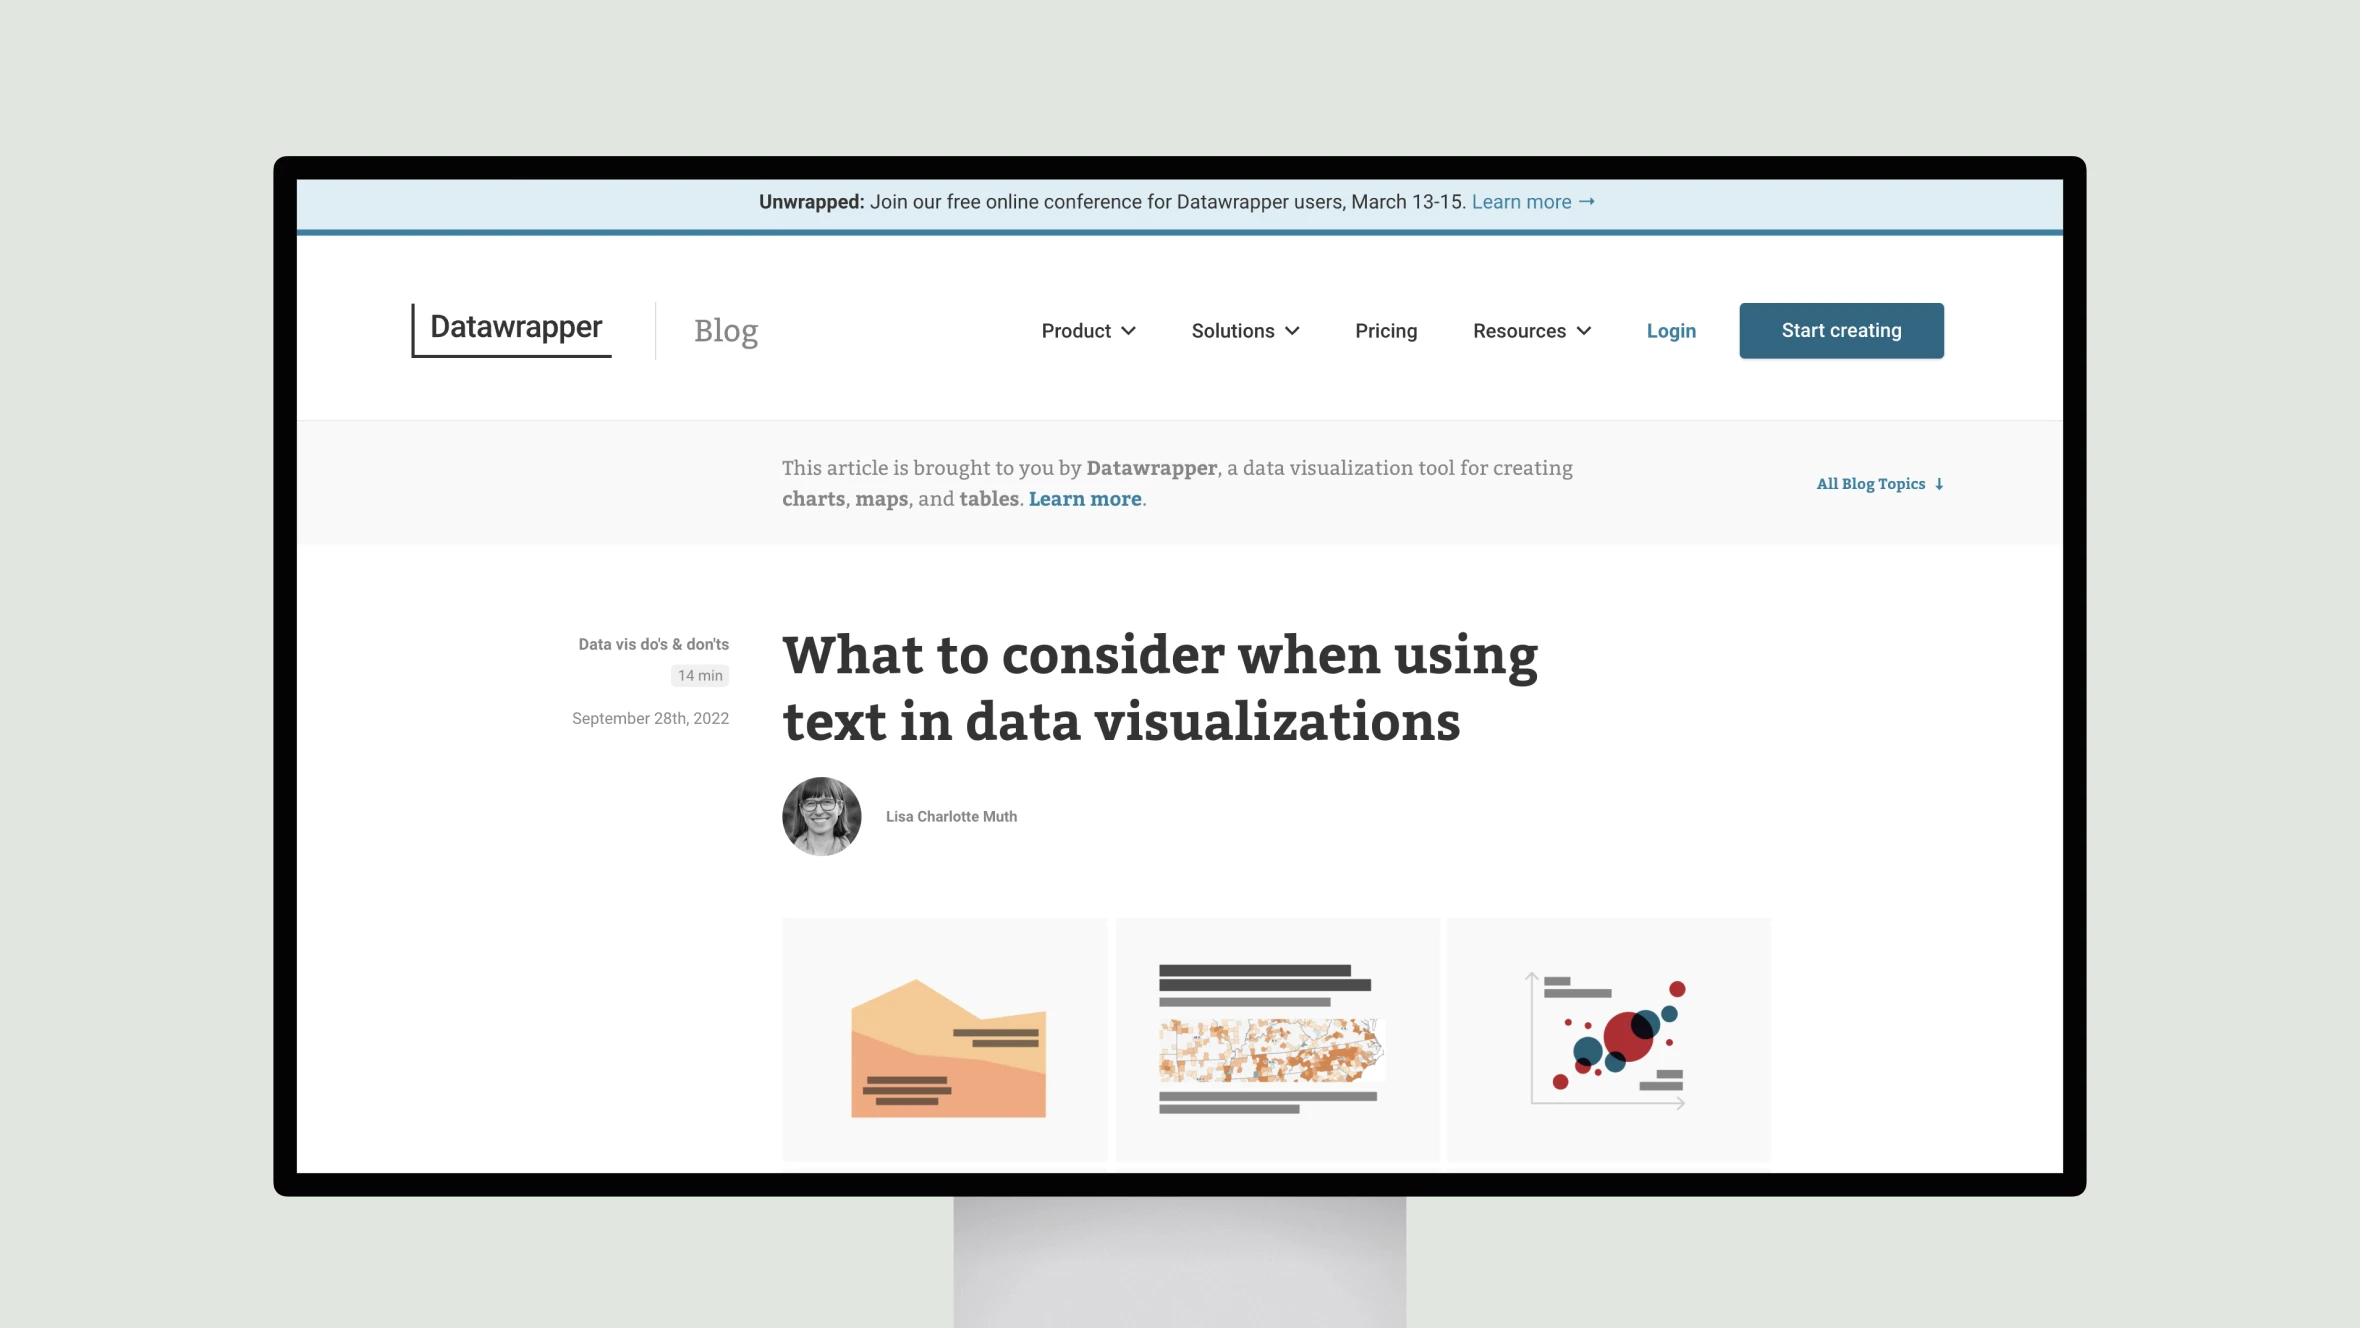
What to consider when using text in data visualizations
Learn best practices for using text in data visualizations, including direct labeling, clear annotations, and reader-focused design for clarity and impact.
Topic(s):
Added on:
UI & UX design inspiration for mobile & web apps.